Published 1 hour ago
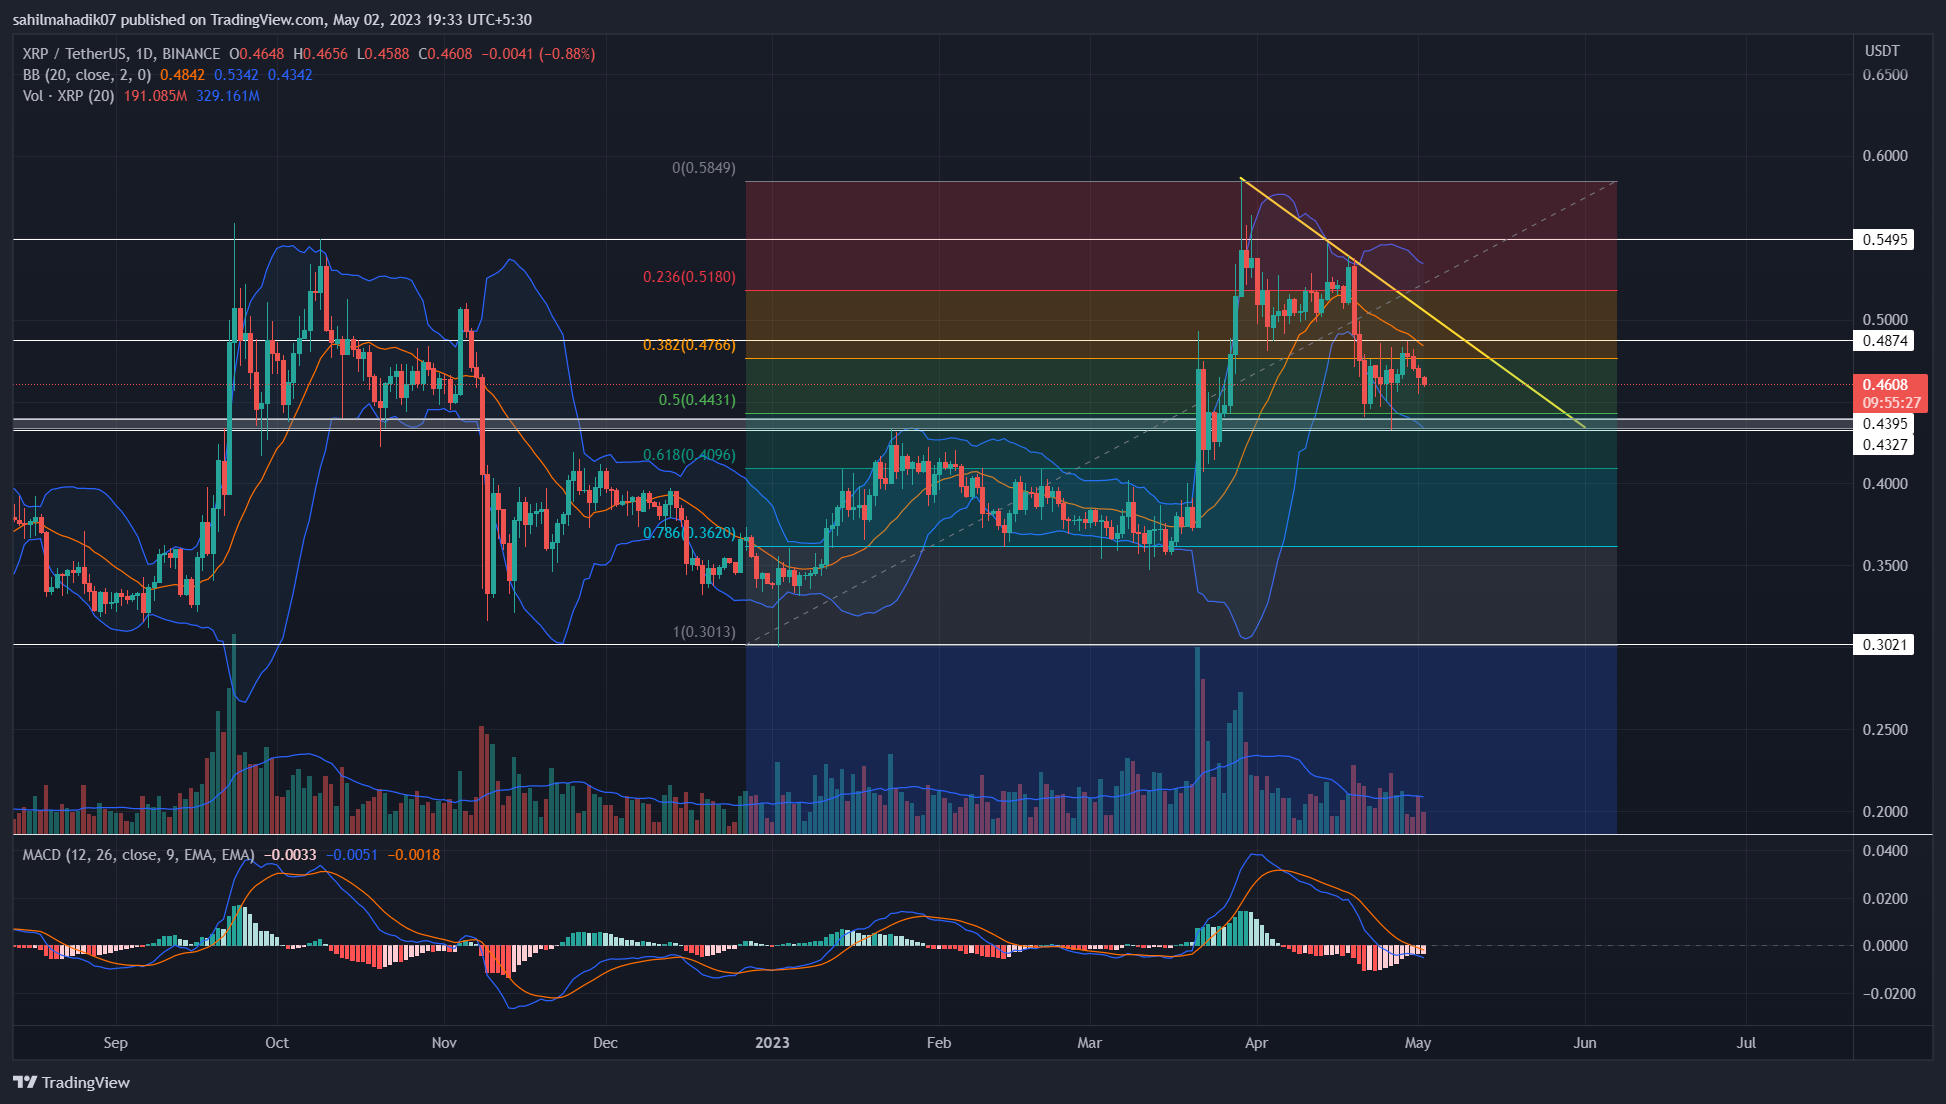
The XRP price has remained in a correction phase for over a month now and has recorded a 25% loss from the peak of $0.585 to $0.433 recent low. However, the bearish pullback halts above the 50% Fibonacci retracement level indicating the overall market sentiment remains bullish. Here’s how this level may further influence the XRP price to replenish bullish momentum
advertisement
Key Points:
- The XRP price falling for four consecutive days with low volume reflects a potential downfall to $0.433 at 0.5 FIB level
- A correction phase to 0.5 FIB is considered healthy and encourages the resumption of a bullish trend
- The intraday trading volume in the XRP is $940.5 Million, indicating a 13.6% gain.
Source- Tradingview
On April 29th, the XRP price turned down from the $0.48 resistance and tumbled the coin price 5.34% to reach the current price of $0.46. This reversal formed a new lower high at the aforementioned resistance indicating a high possibility of downtrend resumption.
With sustained selling, the XRP price is likely to tumble another 6-7% and retest the 50% FIB level at $0.44. During the April fourth week, the daily candle showed multiple lower price rejection candles at this support, validating it as a high accumulation zone.
Trending Stories
Thus, the altcoin is more likely to revert from this support and kickstart a fresh recovery rally. Furthermore, the daily chart shows a new resistance trendline currently carrying the ongoing correction.
A potential breakout from this trendline will be a key signal for the end of the retracement phase and bullish recovery which may bring the coin back to $0.55 higher.
Technical Indicator
Bollinger Band: The lower band of the Bollinger band indicator situated near the $0.44 support increases the support strength of this level.
Exponential Moving Average: The 20-day EMA slope flipped into a significant resistance that could assist sellers to undermine a bullish rally.
XRP Intraday Price Levels
- Spot price: $0.4614
- Trend: Bearish
- Volatility: Low
- Resistance level- $0.487 and $0.55
- Support level- $0.44 and $0.356
Share this article on:
advertisement
The presented content may include the personal opinion of the author and is subject to market condition. Do your market research before investing in cryptocurrencies. The author or the publication does not hold any responsibility for your personal financial loss.
<!– Close Story–>
- SEO Powered Content & PR Distribution. Get Amplified Today.
- PlatoAiStream. Web3 Data Intelligence. Knowledge Amplified. Access Here.
- Minting the Future w Adryenn Ashley. Access Here.
- Source: https://coingape.com/markets/xrp-price-analysis-hints-7-drop-before-buyers-reboot-bullish-recovery-buy-this-dip/

