Published 7 hours ago
SHIB Price Prediction: In the daily time frame chart, the Shiba Inu price has been strictly following a downsloping trendline. This resistance trendline has given the ongoing correction a particular direction and plunge to a 2-month low of $0.00000947. However, as FUD in the crypto market increases the buyers may reattempt to breach this dynamic resistance and trigger a direction rally.
Key Points:
- The current consolidation in Shiba Inu pride reflects uncertainty among traders
- A bullish breakout from overhead resistance will signal an early sign for trend reversal
- The intraday trading volume of the Shiba Inu coin is $301.2 Million, indicating a 3.5% gain.
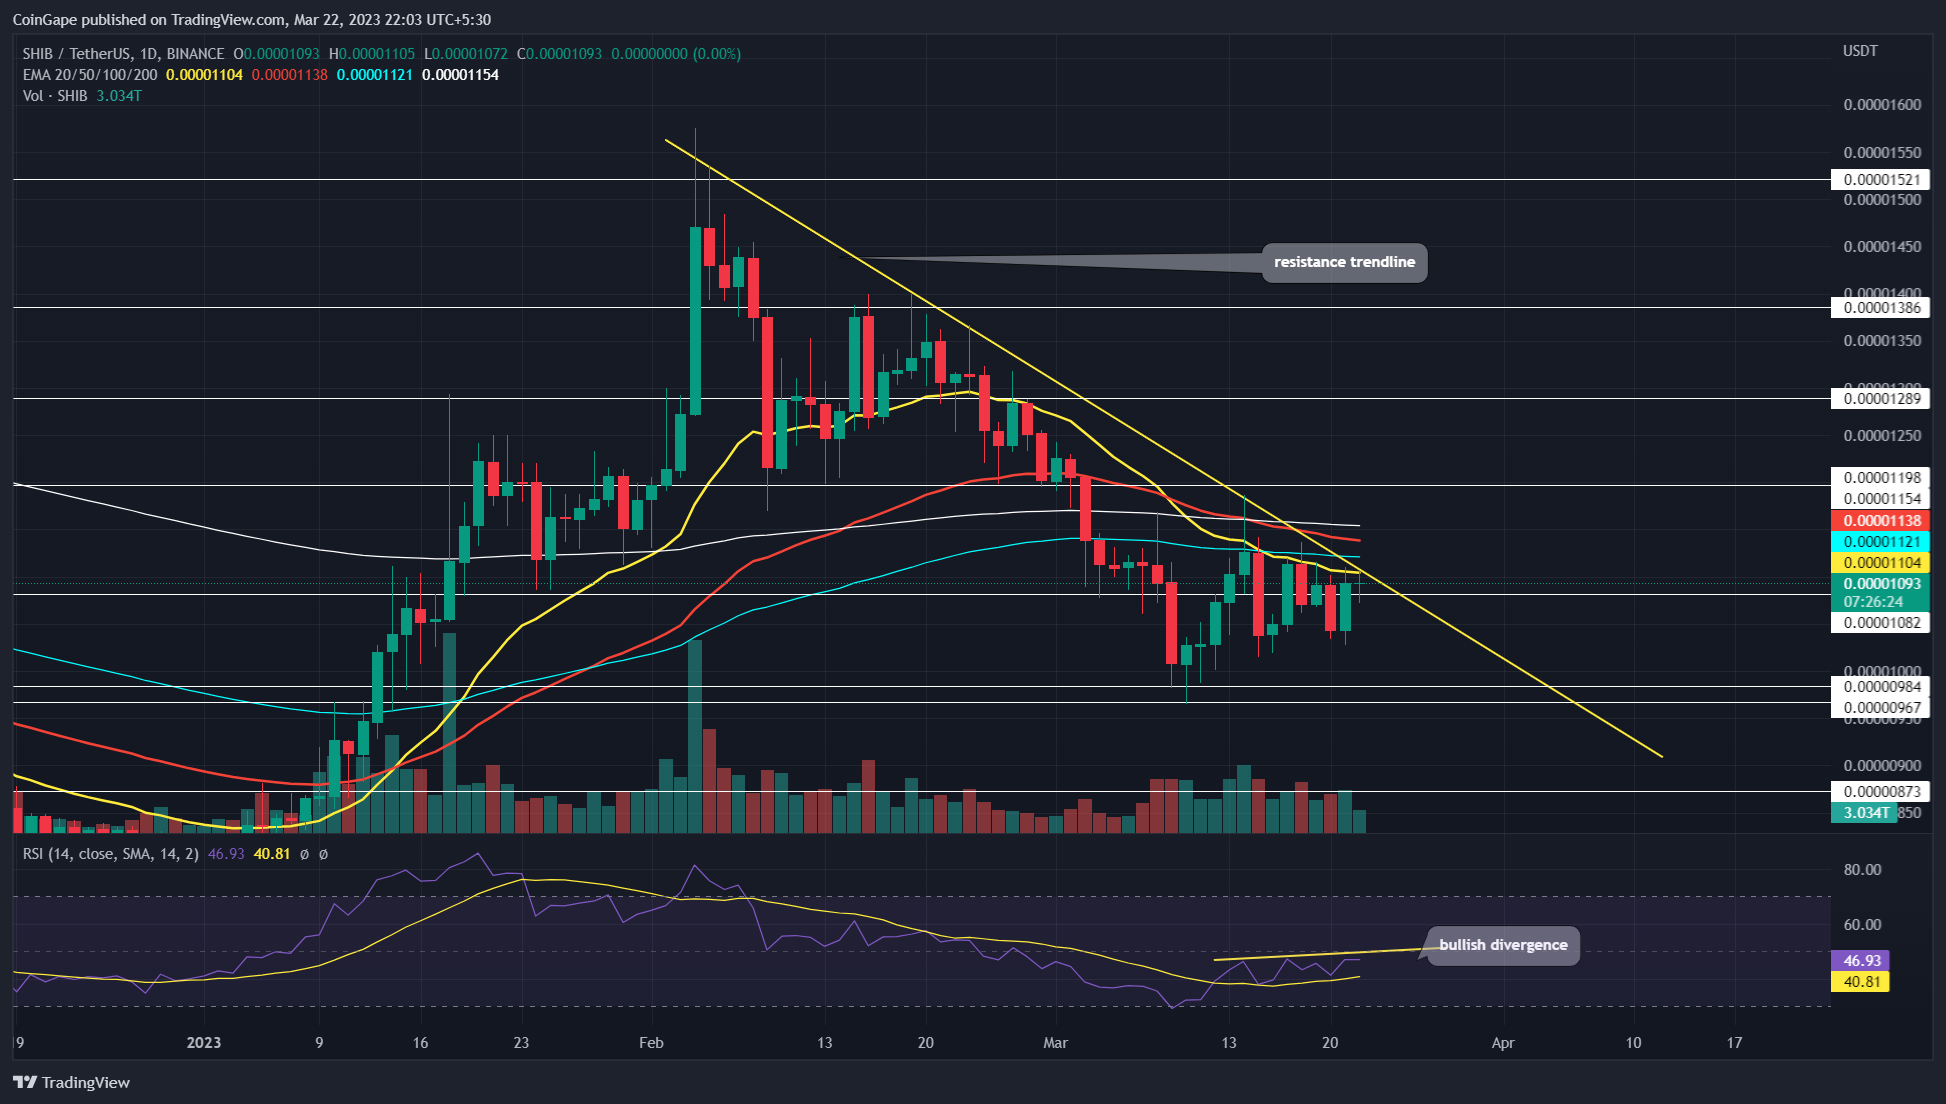
Source- Tradingview
The Japanese dog-themed meme coin, SHIBA, peaked at $0.00001471 limiting January’s growth of 2023 to 82%. Spooked buyers failed to handle the momentum in February resulting in a correction rally that gained momentum over the month and resulted in a resistance trendline.
Trending Stories
However, the bearish outlook seems to bottom out with the overall recovery in the crypto market as Bitcoin shows sustenance over $28,000. Adding to this, the buyers regained control as the prices reached the psychological mark of $0.000010.
Also Read: Top 6 Liquid Staking Platforms On Ethereum
Currently, the price trend shows a struggle among traders evident by the consolidation with increased volatility above $0.000010. At press time, the SHIBA coin price is exchanging hands at $0.00001093 with a minimal change in the last 24 hours.
Nonetheless, the 4.69% jump yesterday keeps the overall look bullish despite the price being stagnant near the resistance trendline. If the buyers manage to regain the momentum overnight or over the next 24 hours, the trendline breakout will extend the bullish momentum to reach $0.000012, followed by $0.000013
Opposingly, if the buyers remain passive, a downtrend will retest the bullish strength at the psychological level of $0.000010. In case the sellers find a breakthrough near $0.000010, the Asian memecoin can slide down to the $0.00000875 mark.
Technical indicator
Relative strength index (RSI) – despite lower high formation in price action, the RSI slope moving higher indicates growth in underlying bullish momentum pressure, which increases the possibility of resistance trendline breakout.
EMAs: the daily EMAs(20, 50, 100, and 200) accumulated near the $0.0000115-$0.000011 area creating multiple hurdles against buyers.
Shiba Inu Coin Price Intraday Levels
- Spot rate: $0.0000109
- Trend: Bearish
- Volatility: High
- Resistance levels- $0.000012 and $0.000013
- Support levels: $0.0000108 and $0.00000984
Share this article on:
advertisement
The presented content may include the personal opinion of the author and is subject to market condition. Do your market research before investing in cryptocurrencies. The author or the publication does not hold any responsibility for your personal financial loss.
<!– Close Story–>
- SEO Powered Content & PR Distribution. Get Amplified Today.
- Platoblockchain. Web3 Metaverse Intelligence. Knowledge Amplified. Access Here.
- Source: https://coingape.com/markets/shib-price-prediction-shiba-inu-coin-is-coiling-up-for-a-massive-upside-move-enter-now/

