- Broke below a key ascending trendline on last Friday, 20 October that has acted as support for prior down moves since December 2022.
- Implied volatility of Nasdaq 100 measured by the CBOE VXN Index has staged a significant bullish breakout and rallied to a 7-month high of 25.31.
- Key short-term resistance to watch will be at 14,615.
- Nasdaq 100’s key component stocks Q3 earnings releases to take note of; Microsoft & Alphabet (Tuesday, 24 October) followed by Meta (Wednesday, 25 October), and Amazon (Thursday, 26 October).
This is a follow-up analysis of our prior report, “Nasdaq 100 Technical: Potential bearish reversal looms” published on 11 October 2023. Click here for a recap.
The US Nas 100 Index (a proxy for the Nasdaq 100 futures) has shaped the expected bearish reversal below the 15,355 key short-term resistance on 12 October and tumbled by -6% to print a current intraday low of 14,425 in today, 23 October (European session) at this time of the writing.
Two key medium-term technical developments have occurred that suggest rising odds that the ongoing decline from its 19 July 2023 high of 15,938 may morph into a potential multi-month major bearish downtrend phase.
Implied volatility of Nasdaq 100 has hit a 7-month high
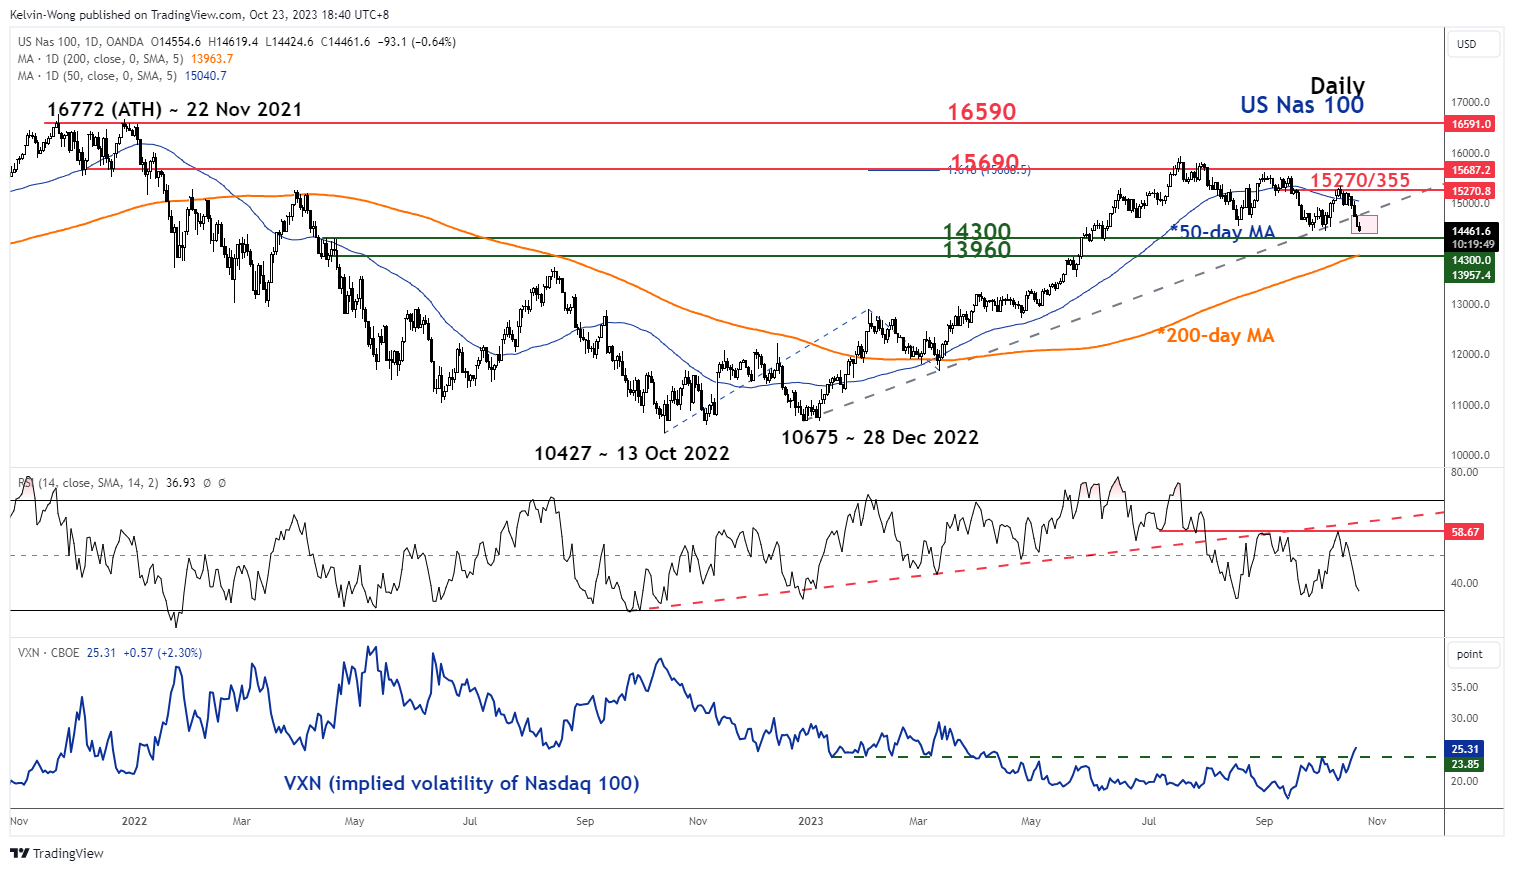
Fig 1: US Nas 100 medium-term trend as of 23 Oct 2023 (Source: TradingView, click to enlarge chart)
Firstly, price actions of the US Nas 100 Index have staged a clear bearish breakdown below its former major ascending trendline from the 28 December 2022 low of 10,675 with a daily close below it last Friday, 20 October 2023. These observations suggest that its 2023 year-to-date rally may be a bearish corrective up move sequence rather than a bullish impulsive one that could propel it to a fresh all-time high level.
Secondly, the implied volatility of the Nasdaq 100 as measured by the CBOE VXN Index has increased significantly in the past three weeks. It cleared above its 23.85 key medium-term resistance and traded at a seven-month high of 25.31 last Friday, 20 October after being compressed to a depressed zone of 18.45 to 17.25 during the summer months of 2023. Higher levels of implied volatility tend to suggest a likely more pronounced down move sequence in the price actions of the Nasdaq 100.
Watch the key short-term resistance at 14,615
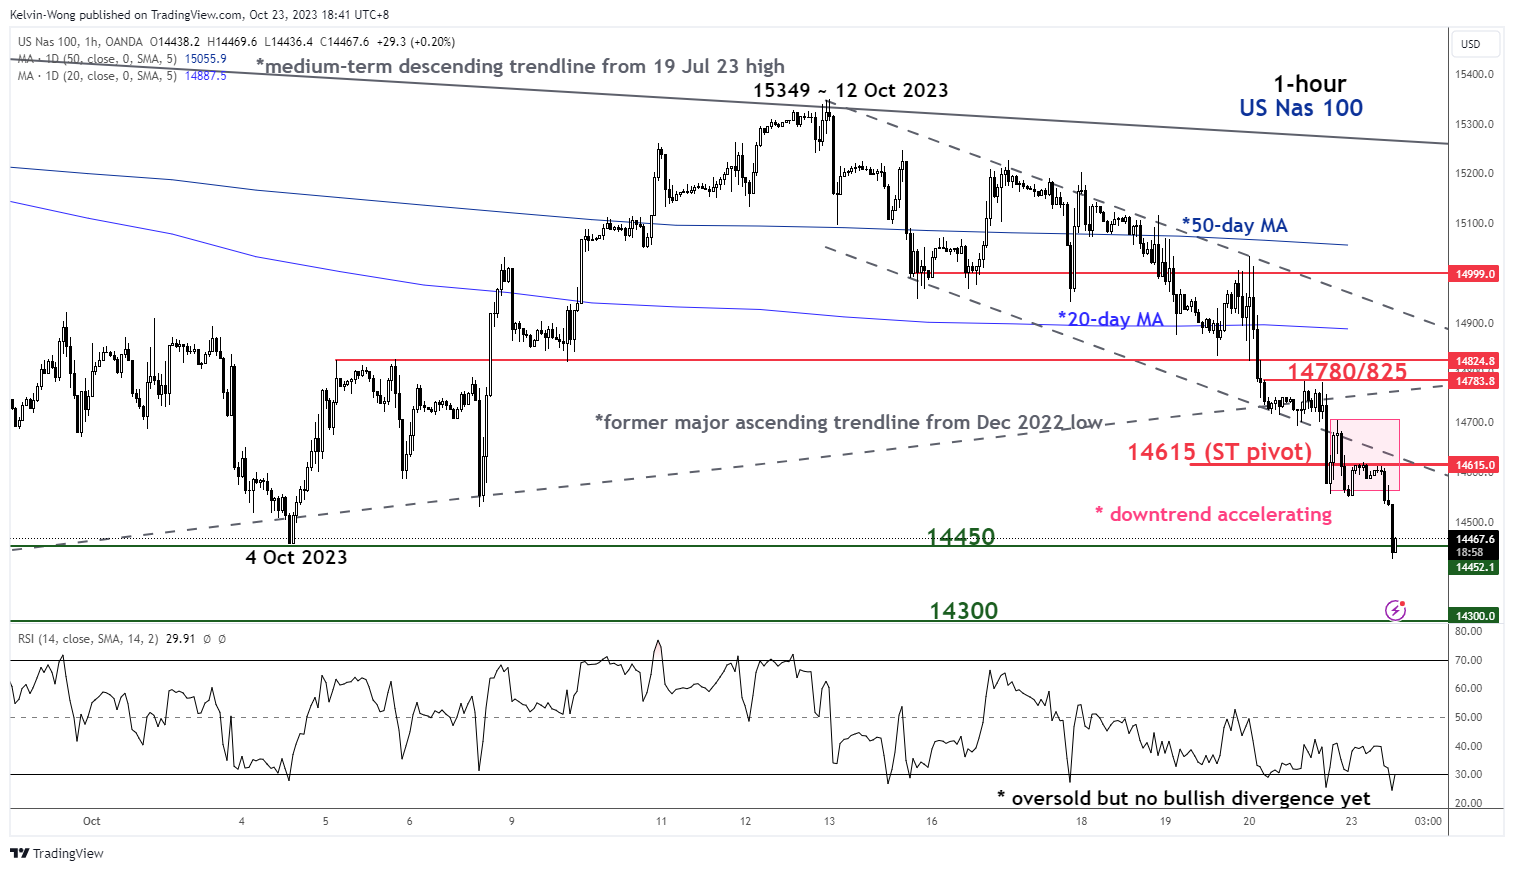
Fig 2: US Nas 100 minor short-term trend as of 23 Oct 2023 (Source: TradingView, click to enlarge chart)
In today’s European session, the short-term price actions of the US Nas 100 Index as seen on its 1-hour chart have failed to reintegrate back into the minor descending channel’s lower boundary that was broken down during last Friday, 20 October (US session) now turns into a pull-back resistance at 14,615.
Also, the hourly RSI indicator has dipped into its oversold region (below 30) but without any clear bullish divergence condition which suggests a potential minor snap-back in price actions may occur towards the 14,530 near-term resistance rather than a more pronounced bullish reversal.
The next intermediate support to watch will be at 14,300 and a break below it exposes the key 200-day moving average now acting as a support at 13,960 (see daily chart).
However, a clearance above 14,615 key short-term pivotal resistance negates the bullish tone for a deeper snap-back towards the next intermediate resistance zone of 14,780/14,825 (the former major ascending trendline from December 2022 low and the 50% Fibonacci retracement of the current downside acceleration from 17 October 2023 minor high to today’s current intraday low of 14,425 at this time of the writing.)
Content is for general information purposes only. It is not investment advice or a solution to buy or sell securities. Opinions are the authors; not necessarily that of OANDA Business Information & Services, Inc. or any of its affiliates, subsidiaries, officers or directors. If you would like to reproduce or redistribute any of the content found on MarketPulse, an award winning forex, commodities and global indices analysis and news site service produced by OANDA Business Information & Services, Inc., please access the RSS feed or contact us at [email protected]. Visit https://www.marketpulse.com/ to find out more about the beat of the global markets. © 2023 OANDA Business Information & Services Inc.
Latest posts by Kelvin Wong (see all)
- SEO Powered Content & PR Distribution. Get Amplified Today.
- PlatoData.Network Vertical Generative Ai. Empower Yourself. Access Here.
- PlatoAiStream. Web3 Intelligence. Knowledge Amplified. Access Here.
- PlatoESG. Carbon, CleanTech, Energy, Environment, Solar, Waste Management. Access Here.
- PlatoHealth. Biotech and Clinical Trials Intelligence. Access Here.
- Source: https://www.marketpulse.com/indices/nasdaq-100-technical-further-potential-downside-pressure-as-key-support-broke/kwong

