Published 10 hours ago
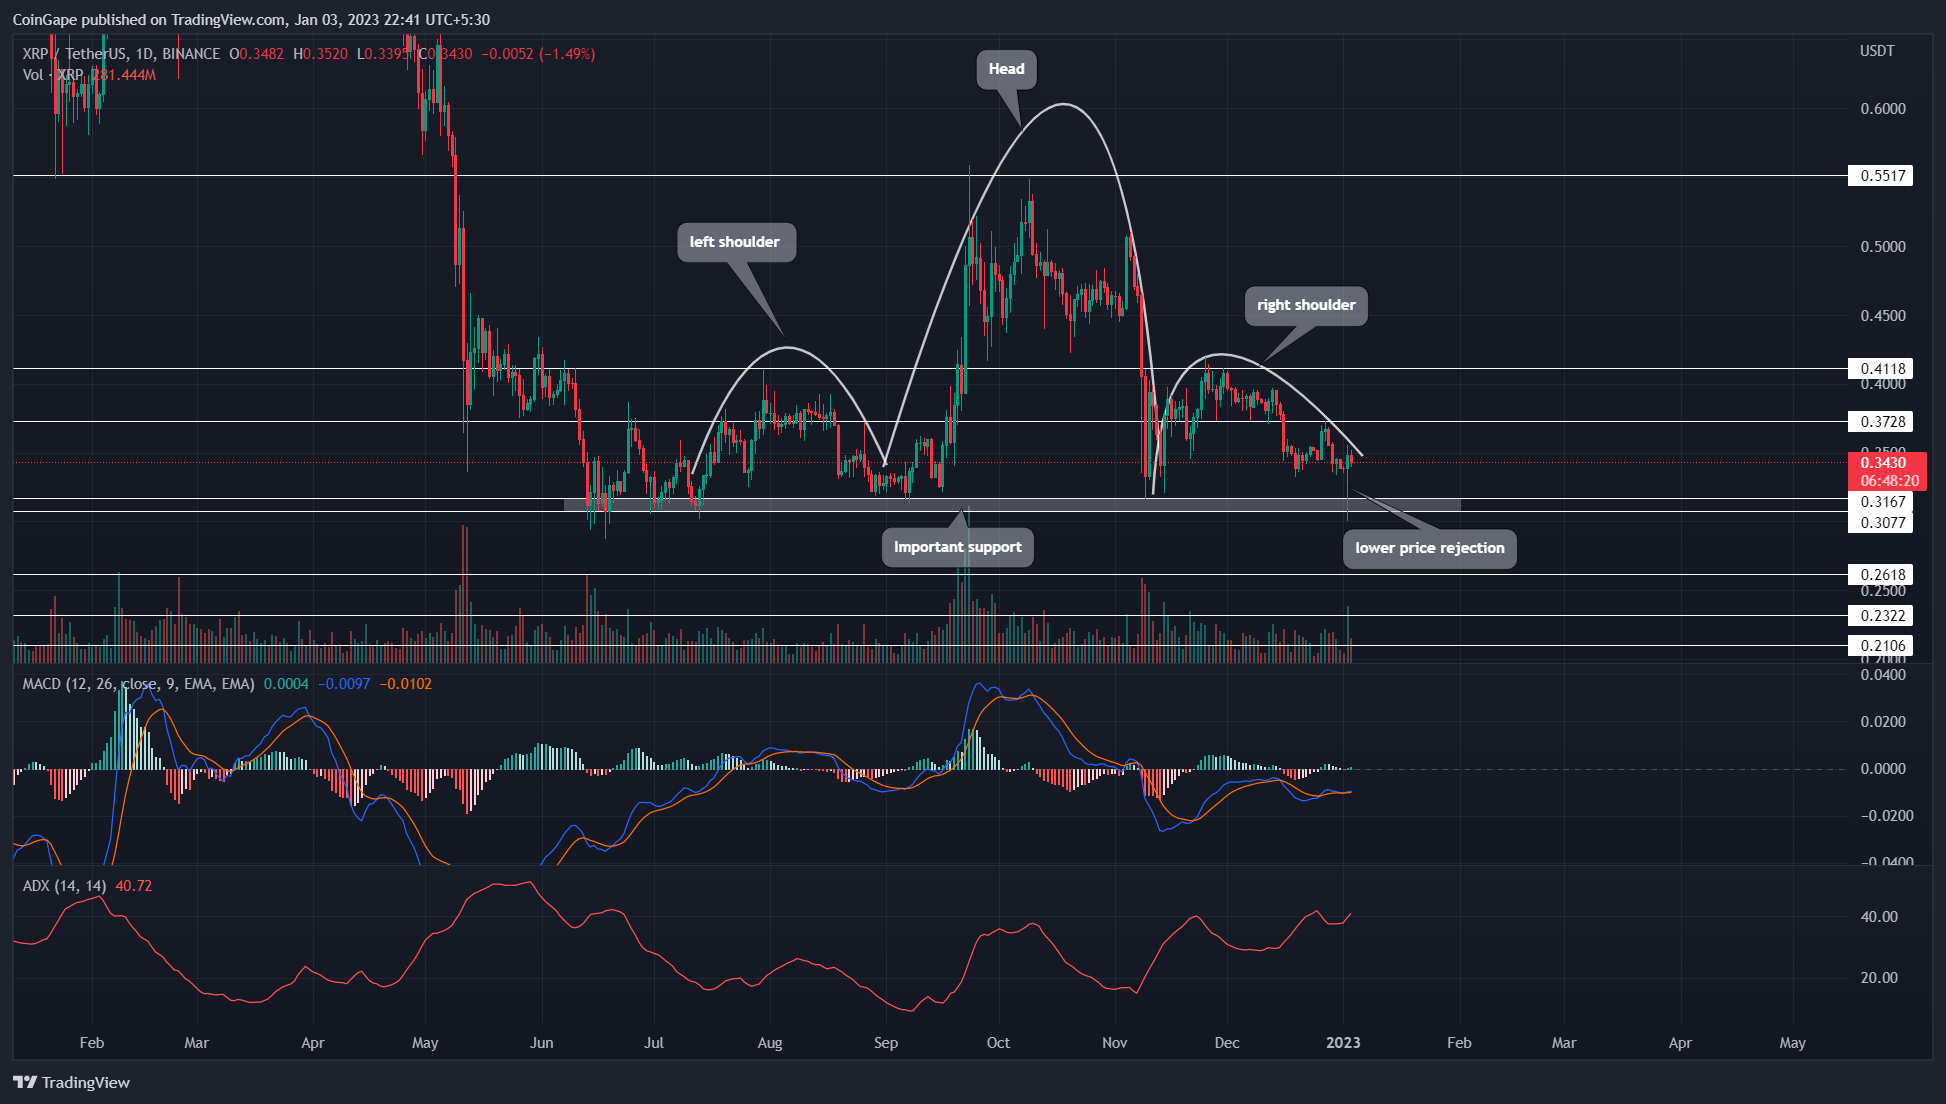
The six-month sideways trend in XRP price has shaped into a head and shoulder pattern. This famous bearish pattern can be identified as two swing highs(shoulders) covering a higher upswing(head); refer to the chart image. In theory, this pattern displayed a sharp trend reversal, where the higher formation(movement from the left should head) turns to a lower low formation(head to right shoulder). This pattern also displays fixed base support whose bearish breakdown signals the resumption of a bearish rally.
advertisement
Key points:
- A bearish breakdown from $0.3 support threatens for 38% drop
- A daily candle closing above $0.41 will offset the bullish thesis
- The intraday trading volume in the XRP price is $898.5 Million, indicating a 21% loss.
Source- Tradingview
By the press time, the Ripple(XRP) price traders at the $0.34 mark, currently forming the right shoulder of the mentioned pattern. However, If the selling pressure persists, the downward spiral will continue and plunge the coin price to multi-month support of $0.316-$0.3.
The aforementioned support is also the neckline of the head and should pattern and has prevented any further losses for XRP price in the last seven months. Moreover, on January 2nd, the daily chart showed a long-lower price rejection candle which indicates the buyers continue to defend this level.
Trending Stories
Also read: XRP Lawsuit Might Not End In Settlement; Here’s Why
However, under the influence of the bearish pattern, the XRP price is more likely to break the $0.3 neckline support. This breakdown will accelerate the bearish momentum and prolong the bearish fall to the $0.21 mark. Thus, the interested trades can look for selling opportunities once the price breaks below the $0.3 support.
On a contrary note, if XRP price starts to rise again, a bullish breakout from $0.37 resistance will weaken the bearish thesis and provide a long entry opportunity for traders. However, for a safer entry, traders could wait for a breakout of the $0.41 mark too.
Technical Indicator
Average Directional Movement Index: the ADX slope rising on every dip in price accentuates the overall trend is bearish.
advertisement
MACD: a number of crossovers between the MACD and signal line show ongoing uncertainty in the crypto market. However, both these slopes are still below the midline, indicating the seller has the upper hand.
XRP intraday price levels
- Spot price: $0.342
- Trend: Bearish
- Volatility: High
- Resistance level- $0.373 and $0.41
- Support level- $0.31 and 0.26
Share this article on:
The presented content may include the personal opinion of the author and is subject to market condition. Do your market research before investing in cryptocurrencies. The author or the publication does not hold any responsibility for your personal financial loss.
- SEO Powered Content & PR Distribution. Get Amplified Today.
- Platoblockchain. Web3 Metaverse Intelligence. Knowledge Amplified. Access Here.
- Source: https://coingape.com/markets/falling-xrp-price-halts-at-0-3-multi-month-support-is-recovery-on-its-way/

