
Published 6 hours ago
On March 17th, the Ethereum coin price gave a decisive breakout from the resistance trendline of the megaphone pattern. The pattern formation itself is a sign of uncertainty among participants accentuating an unclear trend the ETH price witnessed since February 2023. Thus, a bullish breakout from this pattern’s resistance trendline is expected to release the trapped bullish momentum and encourage a significant price rally.
Key Points:
- A bullish breakout from the megaphone pattern’s resistance trendline projects a potential bull-run ahead
- A post-retest rally may push the ETH price 15% higher to hit the $2000 mark
- The intraday trading volume in Ether is $11.9 billion, indicating a 43% gain.
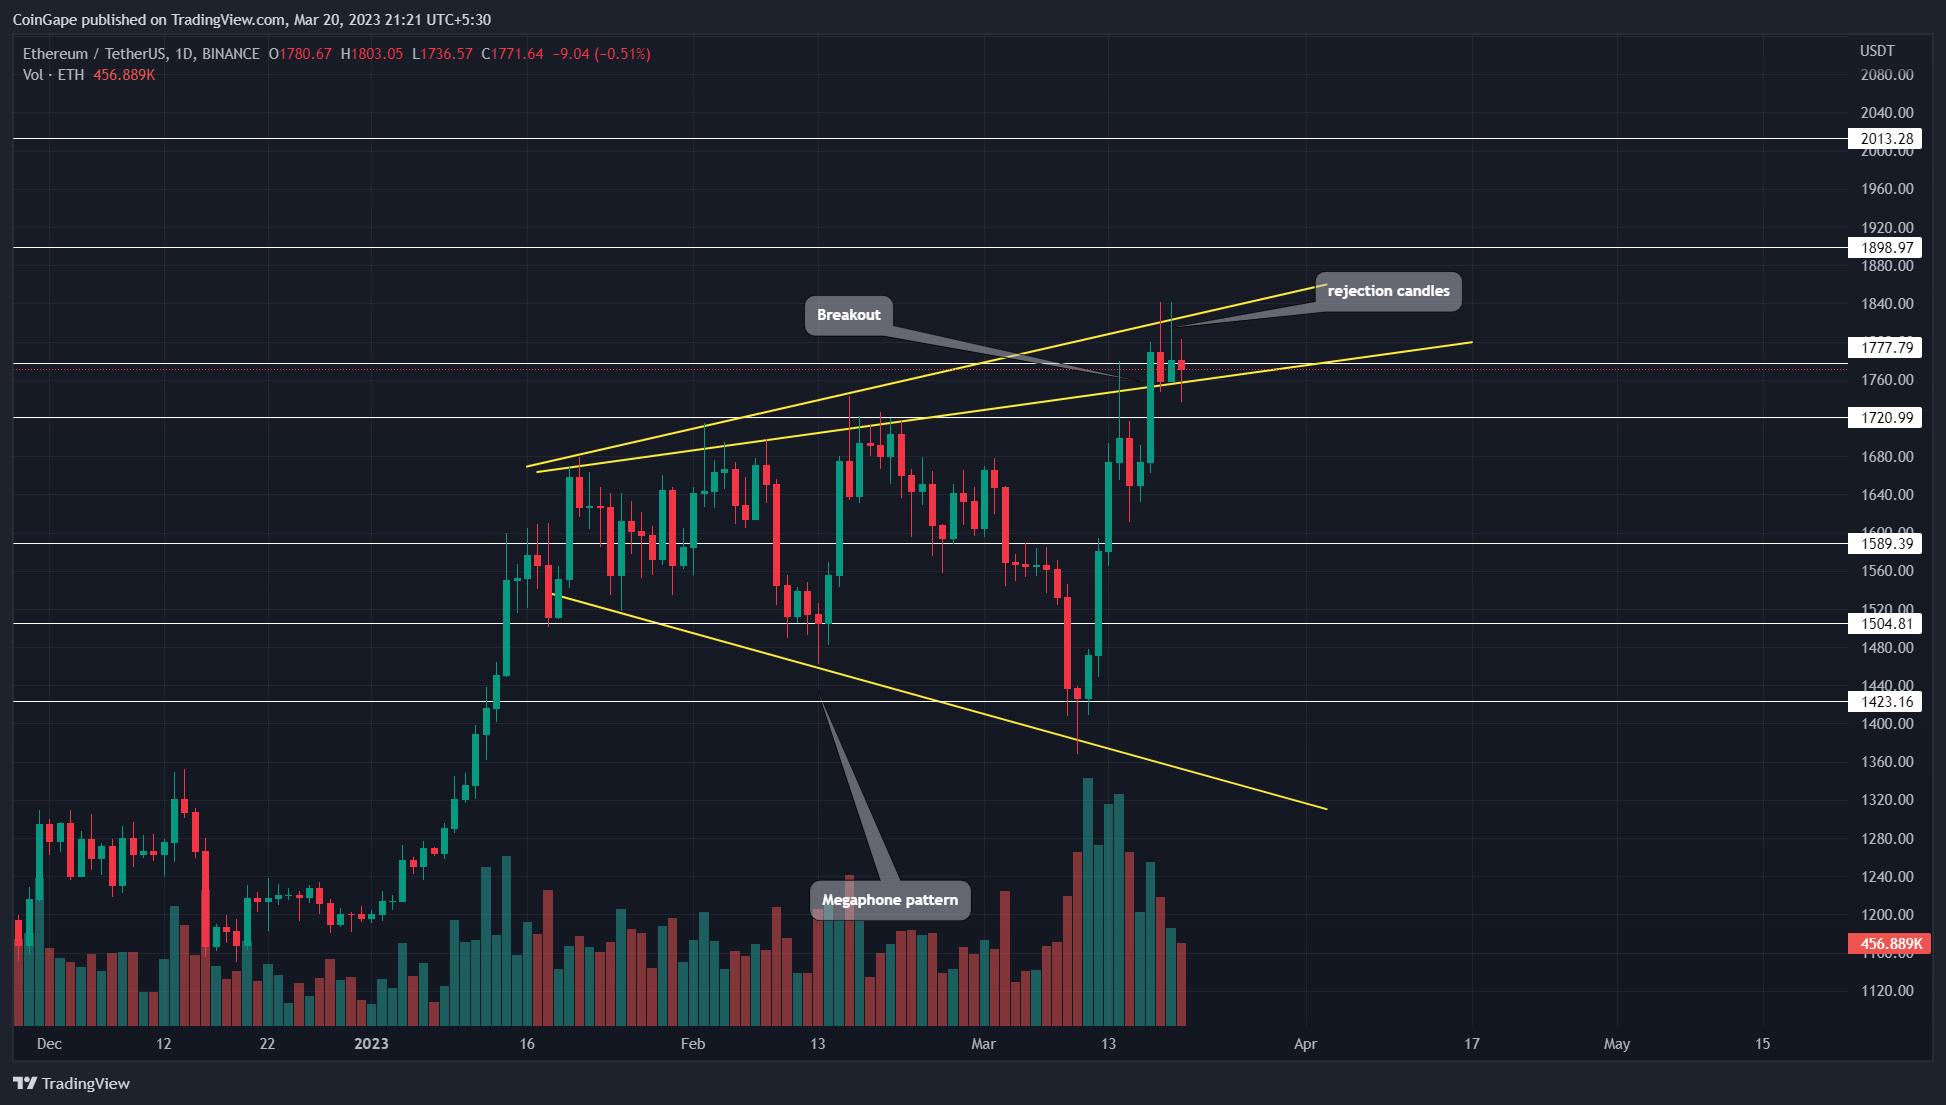
Source- Tradingview
By the press time, the Ethereum price trades at $1766 and continues to hover above the breached trendline of megaphone to check price sustainability at a higher level. Today, the coin price shows a long-lower price rejection candle indicating the buyers attempt to defend the newly reclaimed support
Trending Stories
As per the Fibonacci extension indicator, the buyers may drive the Ether coin price to potential targets of $1890 at 0.786, followed by the 100% FIB level at $2010.
Also Read: Top 6 Liquid Staking Platforms On Ethereum
On a contrary note, the daily chart showed long-wick rejection candles on March 18th and 19th, indicating the sellers are trying to regain trend control. Therefore, the coin holders should check for price suitability above the breached trendline for a few days as additional confirmation.
However, a break below the trendline will consider the prior breakout as a bull trap and may pull the prices back to $1600 support.
Technical Indicator
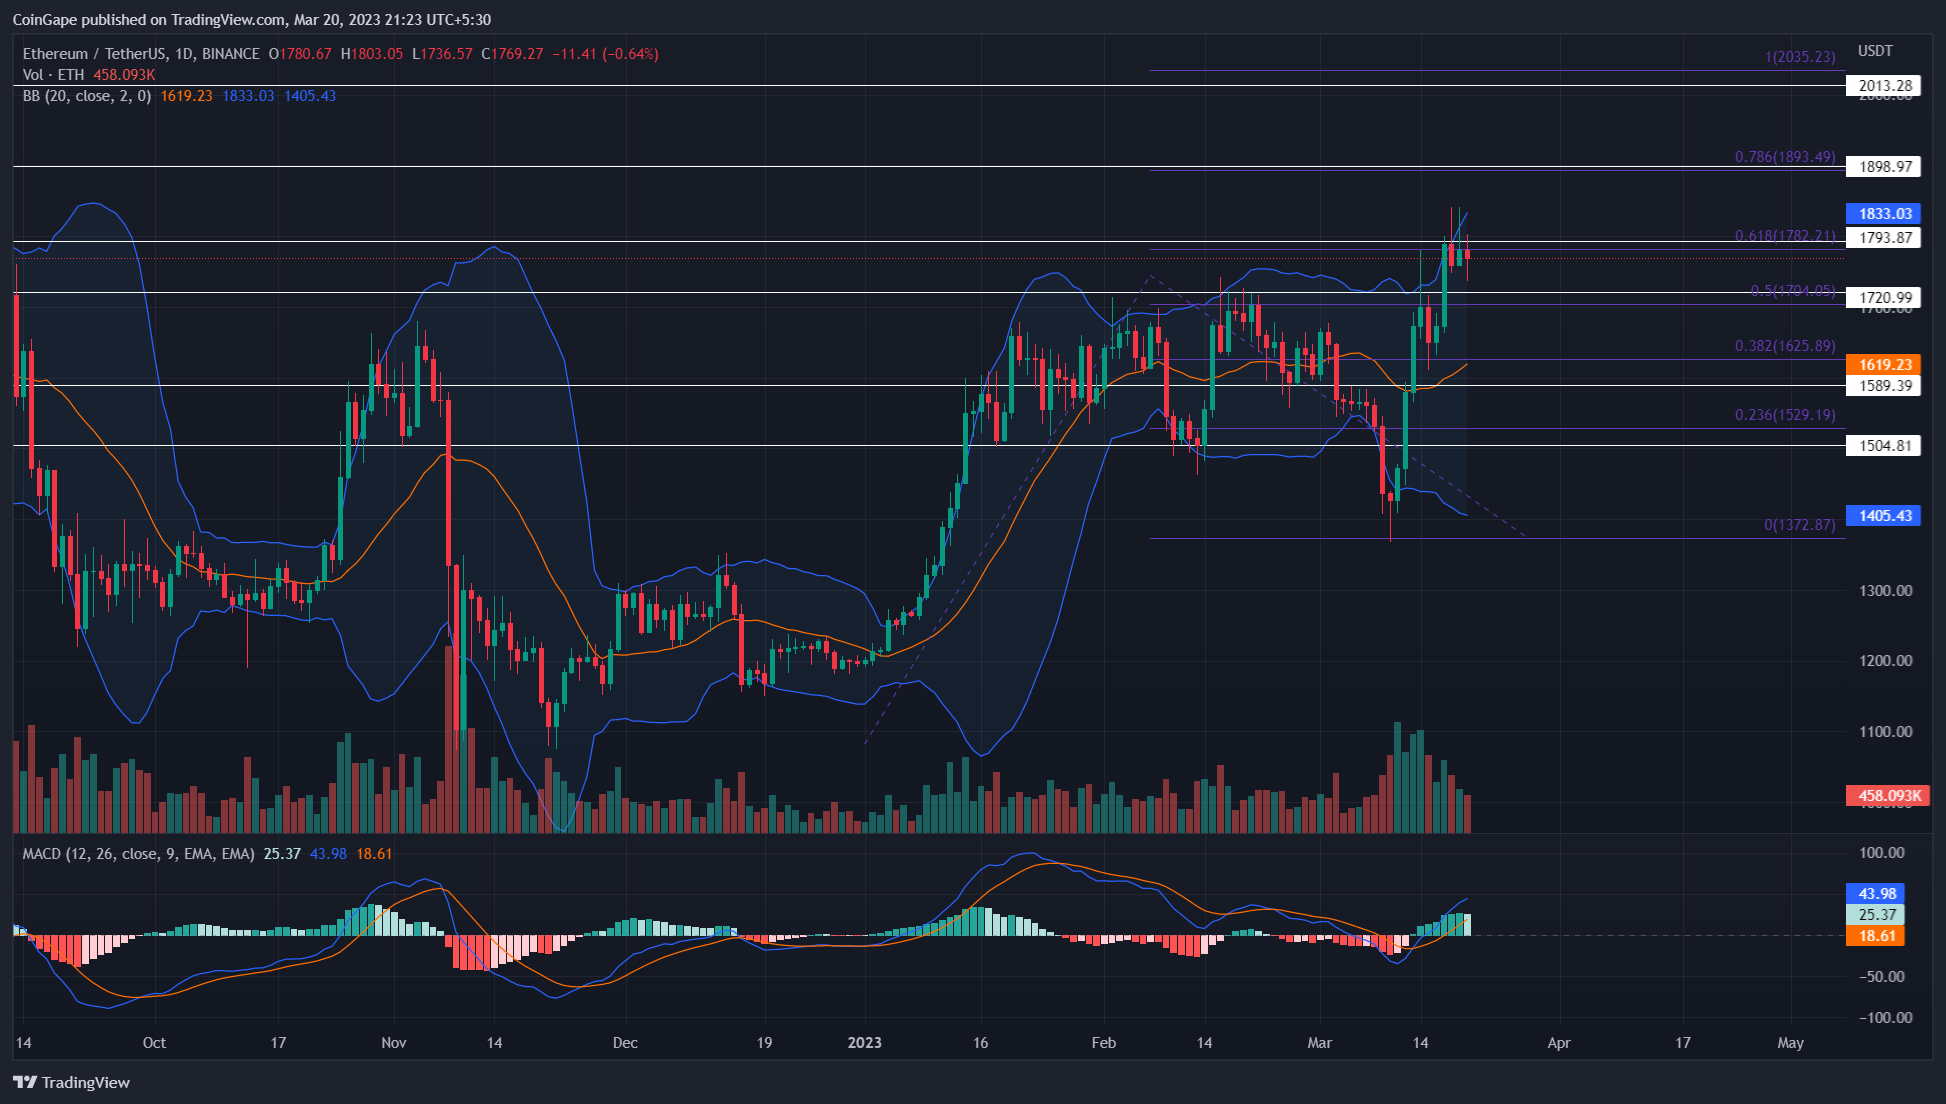
Bolinder Band: the Ethereum coin constantly retesting the upper band of the Bollinger band indicator suggests the prices are trying to stabilize from the prior uptrend. Thus, after a short consolidation, the buyers should resume the prevailing recovery.
MACD: a significant gap between the bullish alignment of MACD(blue) and signal(orange) indicates aggressive buying momentum for Ethereum.
Ethereum Coin Price Intraday Levels-
- Spot rate: $1770
- Trend: Bearish
- Volatility: Medium
- Resistance level- $1890 and $2000
- Support level- $1720 and $1670
Share this article on:
advertisement
The presented content may include the personal opinion of the author and is subject to market condition. Do your market research before investing in cryptocurrencies. The author or the publication does not hold any responsibility for your personal financial loss.
<!– Close Story–>
- SEO Powered Content & PR Distribution. Get Amplified Today.
- Platoblockchain. Web3 Metaverse Intelligence. Knowledge Amplified. Access Here.
- Source: https://coingape.com/markets/ethereum-price-analysis-hints-potential-threat-bull-trap-eth-revisit-1500/

