The XRP price forming a bearish pennant pattern indicates prolonged correction near-term
<!–
–>
Published 2 hours ago
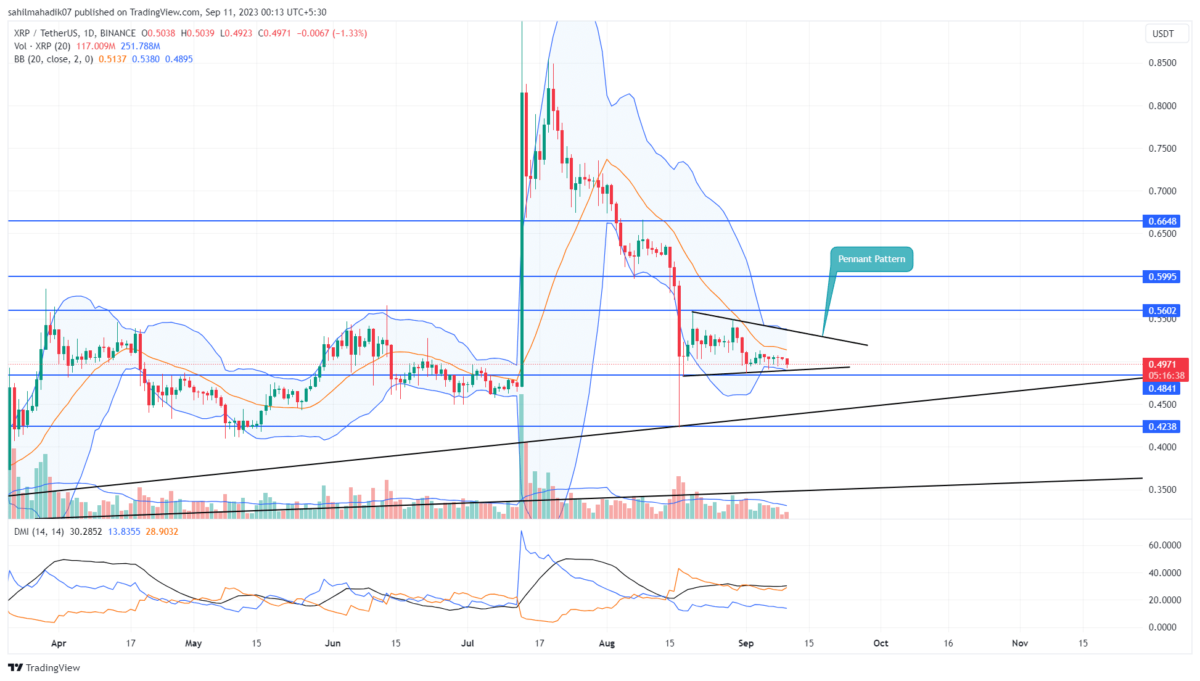
In the midst of prevailing crypto market uncertainty, the XRP price seems to have anchored itself near the $0.48 region. For the past three weeks, the coin price trajectory has been more horizontal than vertical, oscillating within a confined range dictated by two intersecting trend lines. This pattern, known by the trading analysis as a ‘ bearish pennant’, typically leans bearish in nature.
advertisement
<!– markets_after_First_para-300×250 [async] if (!window.AdButler){(function(){var s = document.createElement(“script”); s.async = true; s.type = “text/javascript”;s.src = ‘https://servedbyadbutler.com/app.js’;var n = document.getElementsByTagName(“script”)[0]; n.parentNode.insertBefore(s, n);}());}
var AdButler = AdButler || {}; AdButler.ads = AdButler.ads || [];
var abkw = window.abkw || ”;
var plc571012 = window.plc571012 || 0;
document.write(”);
AdButler.ads.push({handler: function(opt){ AdButler.register(180936, 571012, [300,250], ‘placement_571012_’+opt.place, opt); }, opt: { place: plc571012++, keywords: abkw, domain: ‘servedbyadbutler.com’, click:’CLICK_MACRO_PLACEHOLDER’ }});
–>
Also Read: XRP Holder’s Lawyer Reveals Regional Composition of Those He’s Representing
Bullish Reversal from Key Support Set a Quick 6% Jump
- The daily candle with lower price rejection indicates at the support trendline the demand pressure near $0.5 is intact
- A bearish breakdown from the triangle pattern will set the XRP price at 8.5%
- The intraday trading volume in the XRP is $454 Million, indicating a 9.6% gain

Source: Tradingview
Over the past seven days, XRP price activity has been rather turbulent, constantly wavering above the triangle pattern’s support trendline. The daily chart reveals multiple short-bodied candles with minor price rejections, indicating the indecisive nature of market participants.
Nevertheless, patterns like these often see the price bounce off the support trendline, making its way upward to test the triangle’s upper boundary. With this behavior in mind, there’s potential for XRP to witness a 6% surge, possibly challenging the pennant’s resistance.
Yet, if we’re playing by the book, this pattern often concludes with a break below the lower trendline, potentially ushering XRP price towards the $0.45 mark, a possible decrease of 8.5%.
Will Buyers Rise Back to $0.6?
While bearish undertones color the current XRP narrative, it’s crucial to remember that as long as the pennant holds, the horizontal trend remains dominant. On a brighter note, should the price ascend beyond the triangle’s upper boundary, it could catalyze an influx of buyers, and surge a recovery to $0.6
- Bollinger Band: The narrow range of Bollinger Band indicators reflects the uncertain market trend.
- Directional Movement Index: A negative alignment between the DI+(blue) and DI-(orange) indicates the overall trend remains bearish.
advertisement
The presented content may include the personal opinion of the author and is subject to market condition. Do your market research before investing in cryptocurrencies. The author or the publication does not hold any responsibility for your personal financial loss.
<!– Close Story–>
- SEO Powered Content & PR Distribution. Get Amplified Today.
- PlatoData.Network Vertical Generative Ai. Empower Yourself. Access Here.
- PlatoAiStream. Web3 Intelligence. Knowledge Amplified. Access Here.
- PlatoESG. Automotive / EVs, Carbon, CleanTech, Energy, Environment, Solar, Waste Management. Access Here.
- PlatoHealth. Biotech and Clinical Trials Intelligence. Access Here.
- ChartPrime. Elevate your Trading Game with ChartPrime. Access Here.
- BlockOffsets. Modernizing Environmental Offset Ownership. Access Here.
- Source: https://coingape.com/markets/xrp-price-prediction-will-0-48-support-hold-or-break/

