<!–
–>
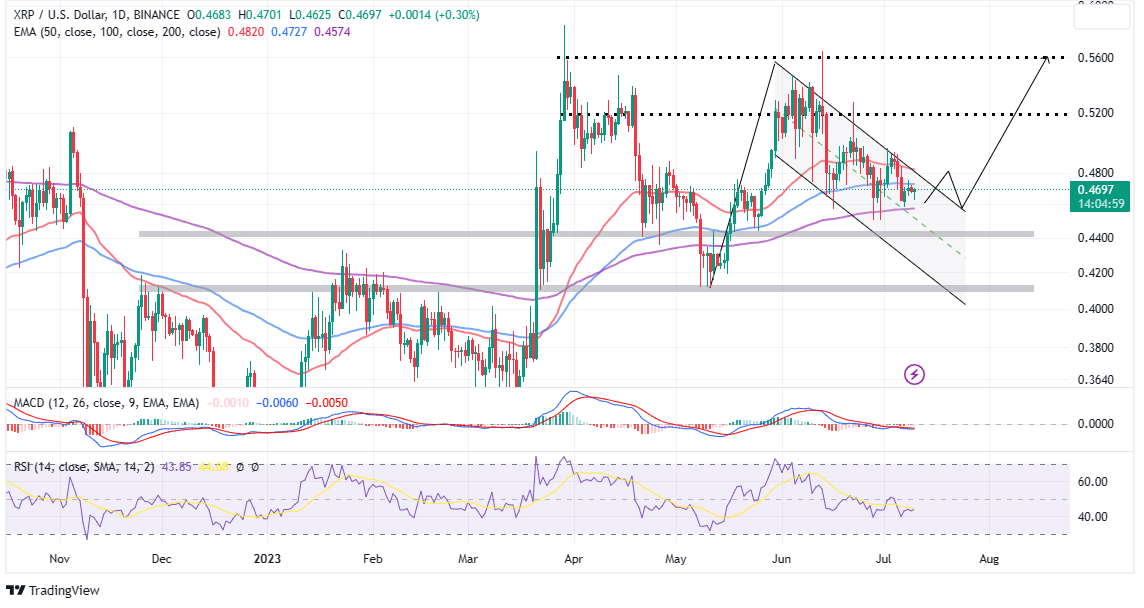
XRP price is still in Limbo with support at $0.46 and resistance at $0.5 despite stepping into the week’s trading. The Asian session on Monday saw XRP wobble around $0.468, with the price staying relatively unchanged since the weekend.
Based on the prevailing short-term technical outlook, the 100-day Exponential Moving Average (EMA) caps movement to the upside at $0.4727. On the other hand, the cross-border money remittance token upholds support at $0.46, with the 200-day EMA in position at $0.4574.
XRP Price Lags Bull Flag Pattern Breakout
The sixth-largest crypto, boasting $24.5 billion in market capitalization and $435 million in trading volume, is patiently waiting for the next big breakout, thanks to the formation of a bull flag pattern on the daily chart.
A bull flag pattern is a bullish continuation pattern that shows a pause in an uptrend, for instance, when XRP price exploded in May from $0.413 to $0.56. Formed by three distinct parts, the pattern comprises a flag pole, a flag, and a breakout.
A sharp rise in price creates the flag pole, the flag is a consolidation phase with parallel support and resistance line, and the breakout occurs when the price resumes the uptrend.
Recommended Articles
Traders eyeing new buy orders in XRP may want to be ready to trigger them as soon as the price breaks above the pattern’s resistance. Conservative investors may want to hold on until the token has cleared resistance at $0.48, with $0.52 and $0.58 standing out as the potential profit targets.
For now, the path with the least resistance is neither to the upside nor to the downside. This lethargic technical outlook upholds the horizontal movement of the Moving Average Convergence Divergence (MACD) and the Relative Strength Index (RSI) indicators.
Buyers will double down their efforts on XRP as the blue MACD line flips above the red signal line. At the same time, the RSI will have to ease into an uptrend aiming for the overbought region.
The longer a breakout delays, the more the XRP price comes under increasing overhead pressure from the bears, which might weaken support at $0.46, and then one provided by the 200-day EMA (in purple).
Declines below the buyer congestion area will likely change the technical outlook, with XRP price plausibly falling to test support at $0.44 and $0.4, respectively.
Related Articles

–>
.text-ad-container { position: relative; padding: 10px 10px 15px; background-color: #fafafa; display: flex; align-items: center;
}
.text-ad-img-container {
width: 100px;
height: 100px;
}
.text-ad-img-container img {
width: 100%;
height: 100%;
object-fit: cover;
}
.text-ad-content-container { display: flex; flex-direction: column; font-family: Montserrat; margin: 0 0 0 10px;
}
.text-ad-content-container h5 { font-size: 22px !important; font-weight: 500 !important; font-family: ‘Montserrat’ !important; line-height: 2.08 !important; color: #222 !important; margin: 0; display: flex;
}
.text-ad-content-container h6 {
font-size: 15px !important; font-weight: normal !important; font-family: Georgia; line-height: 2.5 !important; letter-spacing: 0.07px; color: #444 !important; margin: 0;
}
.text-ad-button { background-color: #19936d !important; margin: 6px 0 0; padding: 5px 14px; display: block; width: fit-content; text-transform: uppercase; font-size: 14px; letter-spacing: -0.3px; font-weight: 600 !important; color: #fff !important; text-decoration: none !important;
} .text-ad { border-radius: 2px; background-color: #fff; width: 25px; height: 25px; color: #444; font-size: 12px; border: 1px solid #b6d0e2; display: flex; font-weight: normal; letter-spacing: 0.07px; justify-content: center; align-items: center; position: absolute; top: 5px; right: 5px;
} @media only screen and (max-width: 768px) {
.text-ad-content-container h6 { font-size: 14px !important; line-height: 2 !important;
}
} @media only screen and (max-width: 600px) {
.text-ad-container {
padding: 5px 0 10px;
}
.text-ad-button {
margin: 10px 0 0;
padding: 4px 12px;
}
.text-ad-content-container {
width: 65%;
margin: 0 0 0 5px;
}
.text-ad-content-container h5 {
display: none;
}
.text-ad-content-container h6 {
font-size: 12px !important;
}
.text-ad {
top: auto; right: 5px; bottom: 5px;
}
}

AD
<!–


–>
<!–


–>
- SEO Powered Content & PR Distribution. Get Amplified Today.
- PlatoData.Network Vertical Generative Ai. Empower Yourself. Access Here.
- PlatoAiStream. Web3 Intelligence. Knowledge Amplified. Access Here.
- PlatoESG. Automotive / EVs, Carbon, CleanTech, Energy, Environment, Solar, Waste Management. Access Here.
- BlockOffsets. Modernizing Environmental Offset Ownership. Access Here.
- Source: https://coingape.com/xrp-price-prediction-assessing-this-weeks-profitability-prospects-amidst-economic-uncertainty/

