In a detailed analysis shared on social media today, renowned crypto analyst Egrag points to several bullish indicators in the XRP price structure, suggesting the potential for an imminent breakout. Egrag evaluated various timeframes, identifying a series of technical patterns and formations that bolster the bullish outlook.
XRP Shows Strong Bullish Structural Signs
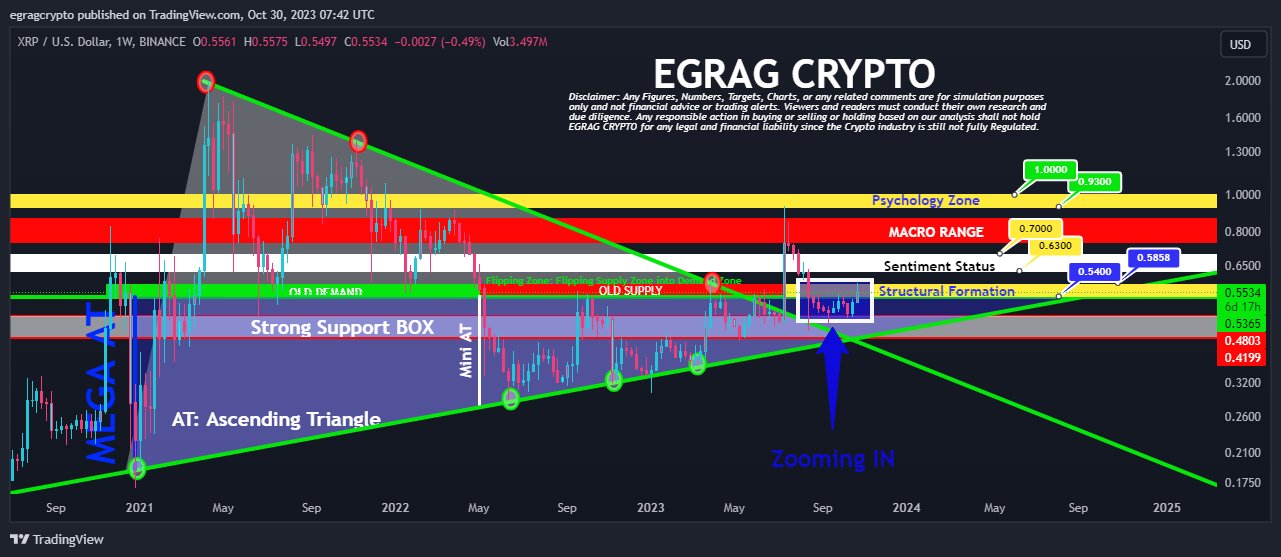
“Last week’s candle closed within the confines of the Yellow structural formation,” Egrag tweeted with regard to the weekly XRP/USD chart, emphasizing the significance of recent movements within the timeframe. This observation is instrumental in understanding the underlying market structures influencing the upcoming price action.
The implication? If another weekly candle were to affirm its position within this formation, the odds of a bullish trend continuation could significantly increase. “To confirm a bullish trend continuation, we need to see another weekly candle close with a full body inside this structure,” Egrag added.
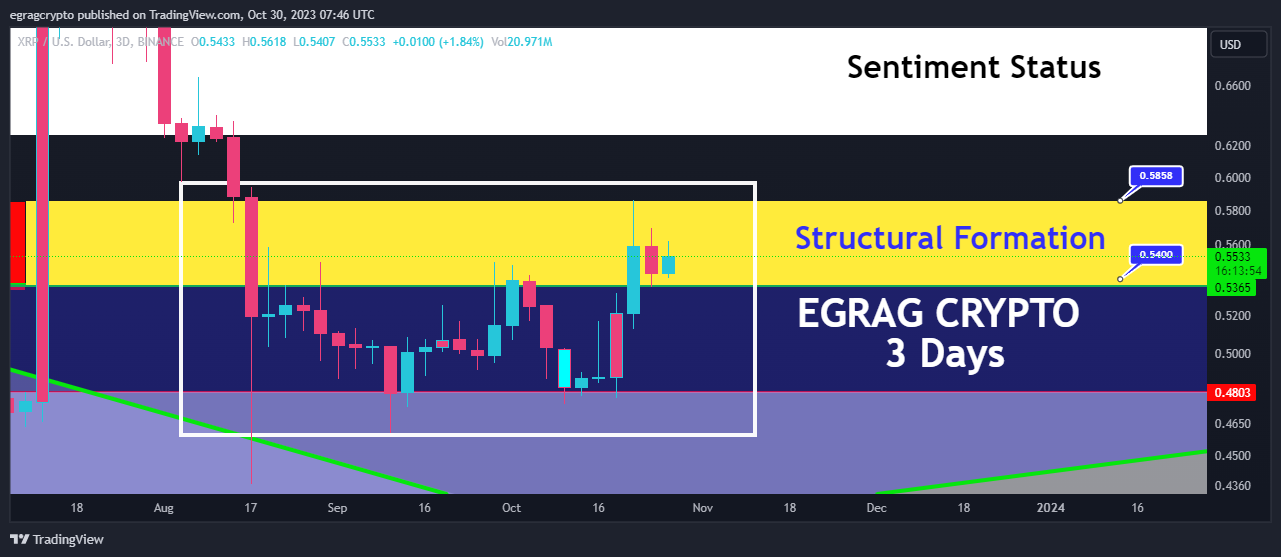
Next, his insights extend further to the three-day chart, where he keenly observes, “In just 16 hours, XRP is poised to complete the second full body candle within the structural formation, signaling a strong bullish sentiment.” This near-term projection underscores a sense of momentum that appears to be building within the XRP market.
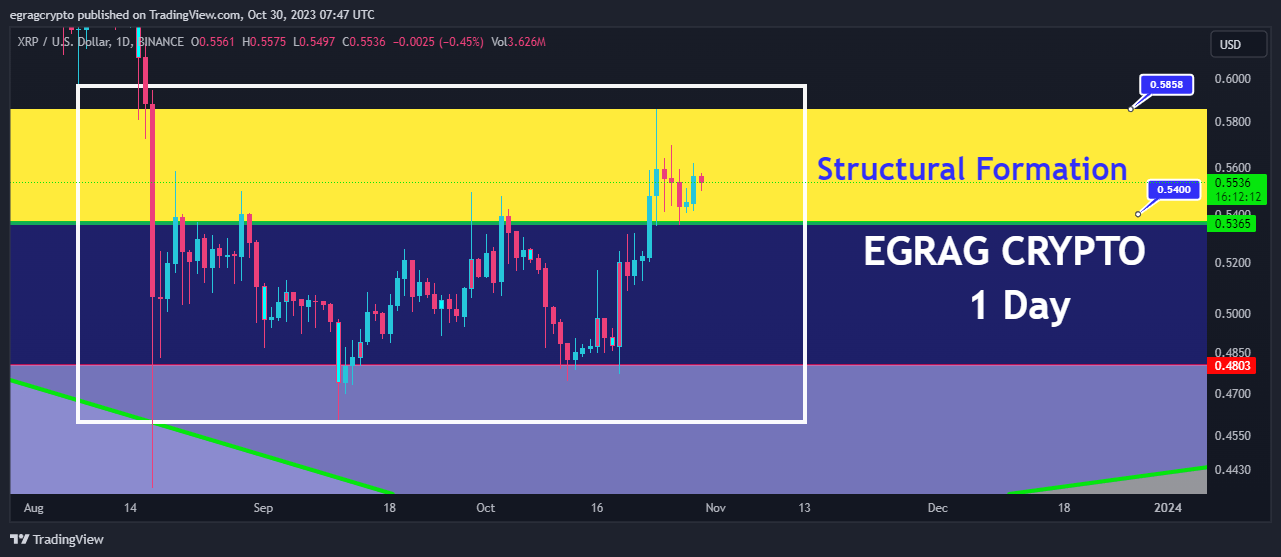
The 1-day chart, too, garnered Egrag’s scrutiny. He highlighted the imminent completion of the seventh full-body candle within the current structure, stating this indicates an “extremely bullish trend.” This observation suggests that XRP’s bullish behavior isn’t just a fleeting phenomenon but has consistency across varying timeframes.
For traders with a penchant for shorter timeframes, Egrag’s insights into the 12-hour chart are particularly salient. While there have been multiple closures within the structural formation, he singled out the importance of the ongoing momentum: “The current candle and the next one are pivotal as they form a symmetrical triangle.”
He elaborated on the implications of this pattern, saying, “Typically, symmetrical triangle breakouts have a 50/50 chance, making this a decision point for XRP.”
XRP Price Targets
Circling back to a tweet from October 27, Egrag had demarcated significant price zones, highlighting the “$0.54 to $0.58” range as a make-or-break threshold. Beyond this, he indicated the “$0.63-$0.70” range as a pivotal indicator of market sentiment shifts.
For those with an eye on the psychological dimensions of trading, Egrag’s mention of the “0.93-$1” bracket is noteworthy. He cautioned traders about this zone, advising them to “Stick to your plan and resist the temptation to let emotions or impatience dictate your actions.”
In sum, Egrag’s comprehensive analysis blends technical data with trader sentiment and psychology, providing a nuanced and detailed perspective for those invested in XRP. The coming days are likely to be watched with bated breath as traders anticipate the next big move.
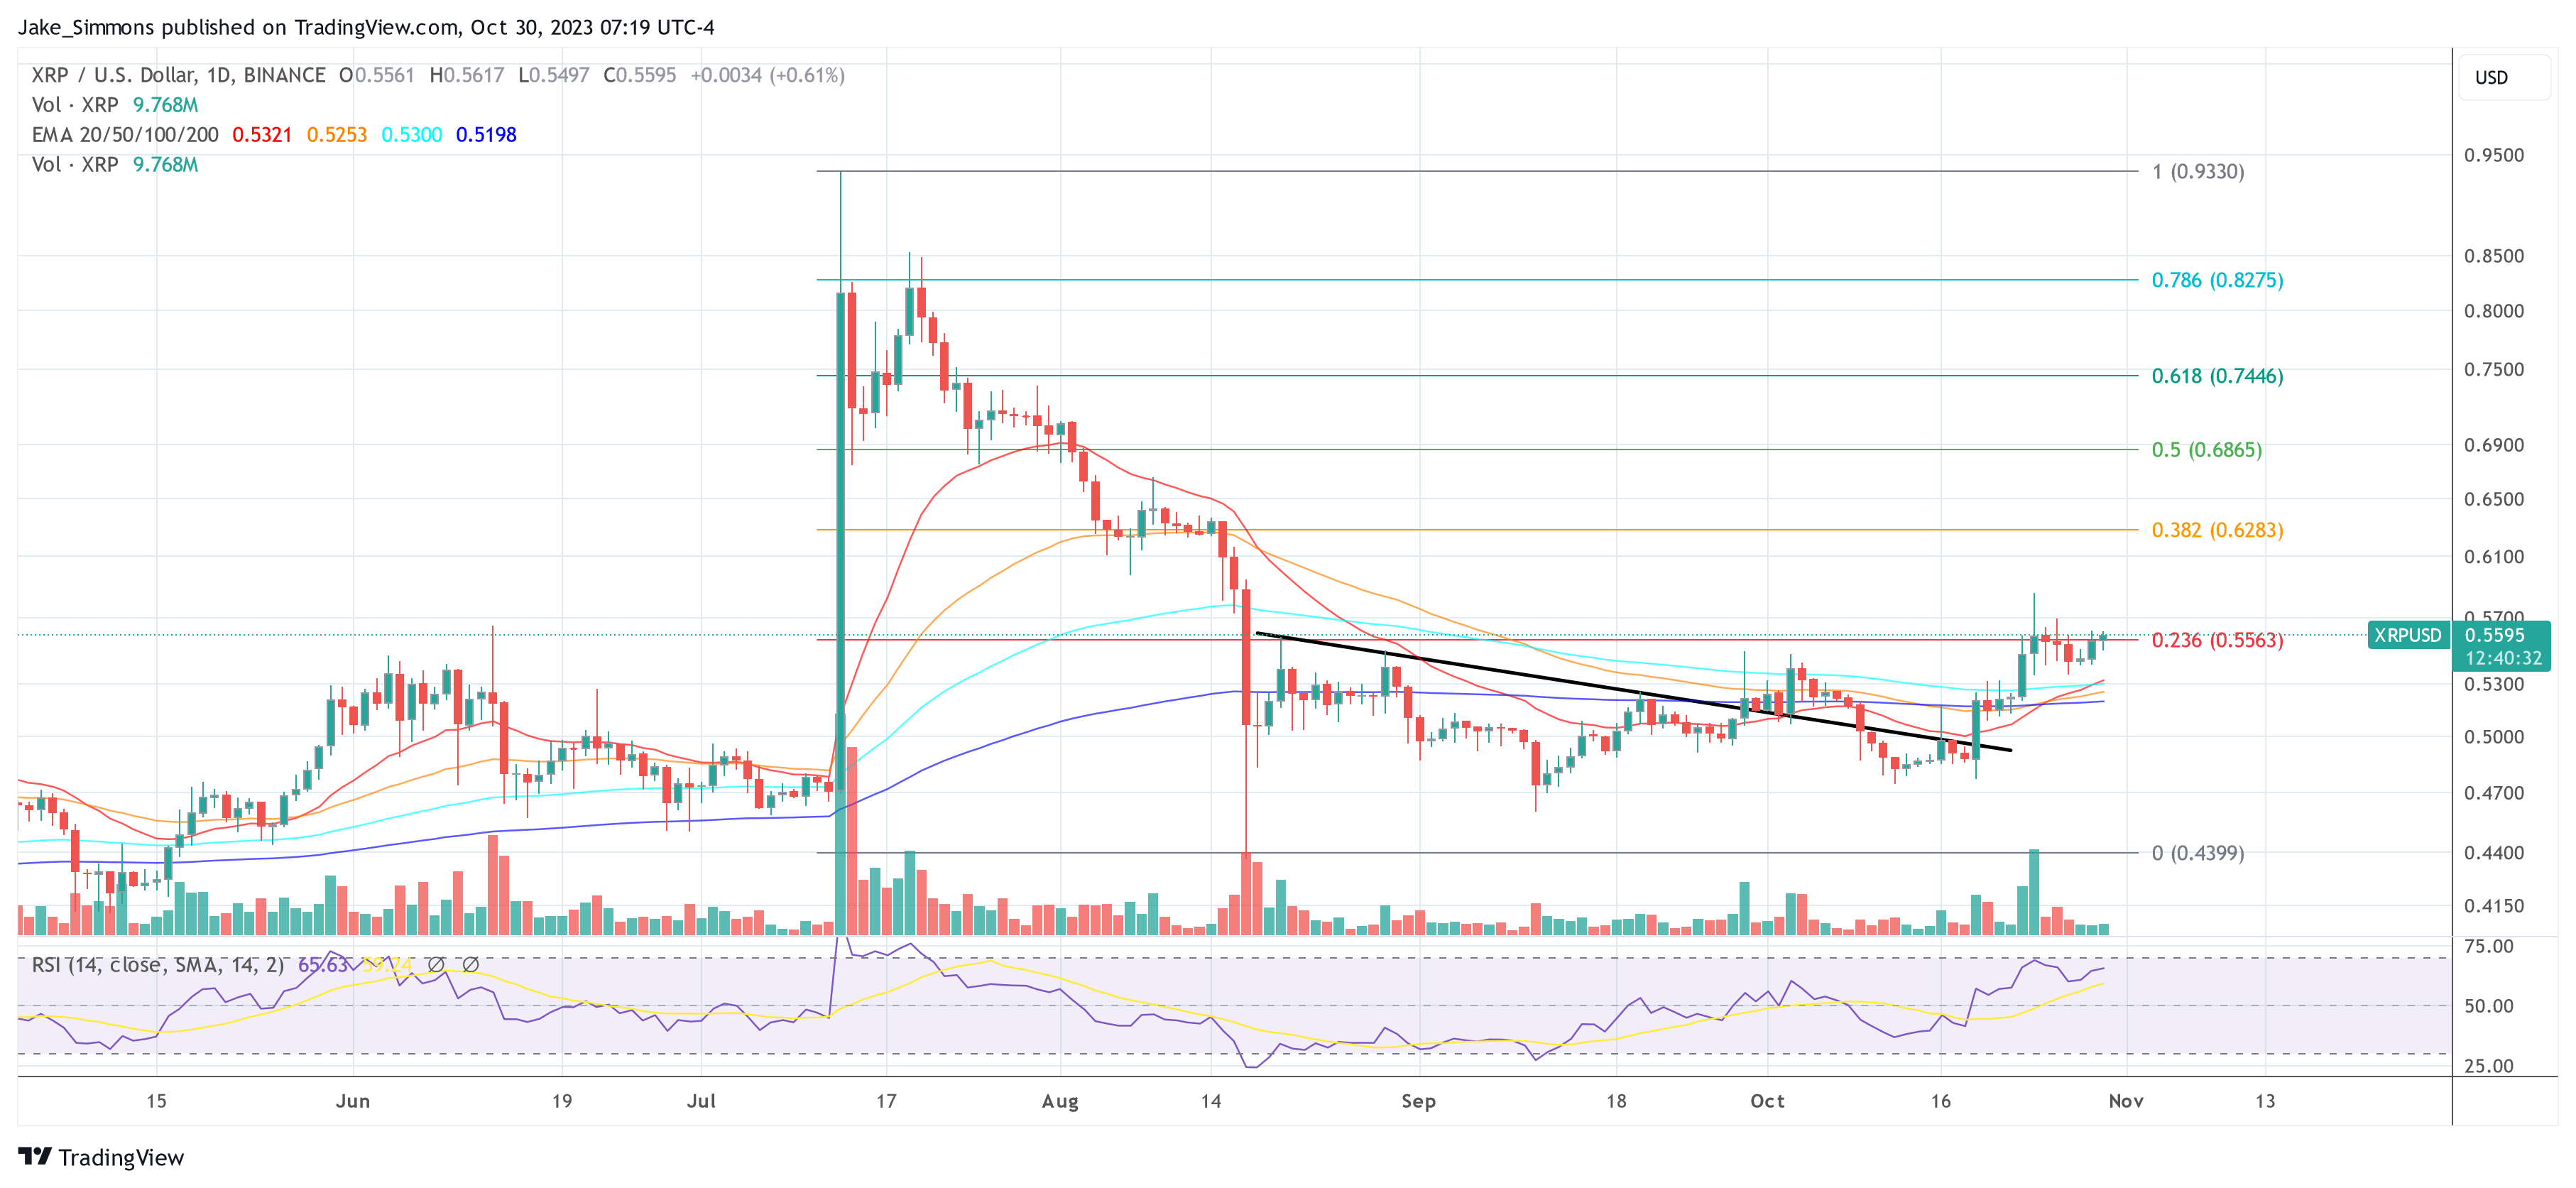
At press time, XRP traded at $0.5595.
Featured image from Shutterstock, chart from TradingView.com
- SEO Powered Content & PR Distribution. Get Amplified Today.
- PlatoData.Network Vertical Generative Ai. Empower Yourself. Access Here.
- PlatoAiStream. Web3 Intelligence. Knowledge Amplified. Access Here.
- PlatoESG. Carbon, CleanTech, Energy, Environment, Solar, Waste Management. Access Here.
- PlatoHealth. Biotech and Clinical Trials Intelligence. Access Here.
- Source: https://www.newsbtc.com/analysis/xrp/xrp-price-breakout-soon-analyst-bullish-structural-signs/

