<!–

–>
Published 1 day ago
The ongoing correction phase in XRP price from suitable support at the $0.6 level. Amid the three weeks downfall, the altcoin registered a 36.5% loss as the price dropped from the July 13th high of $$0.938 to the $0.596 low. The aforementioned support aligned with the 50% Fibonacci retracement level creates a strong footing for buyers to replenish bullish momentum. Should you enter this dip?
advertisement
XRP News: Gemini Relists XRP Token, Opens Support For XRP Ledger (XRPL)
XRP Chart: Key Points
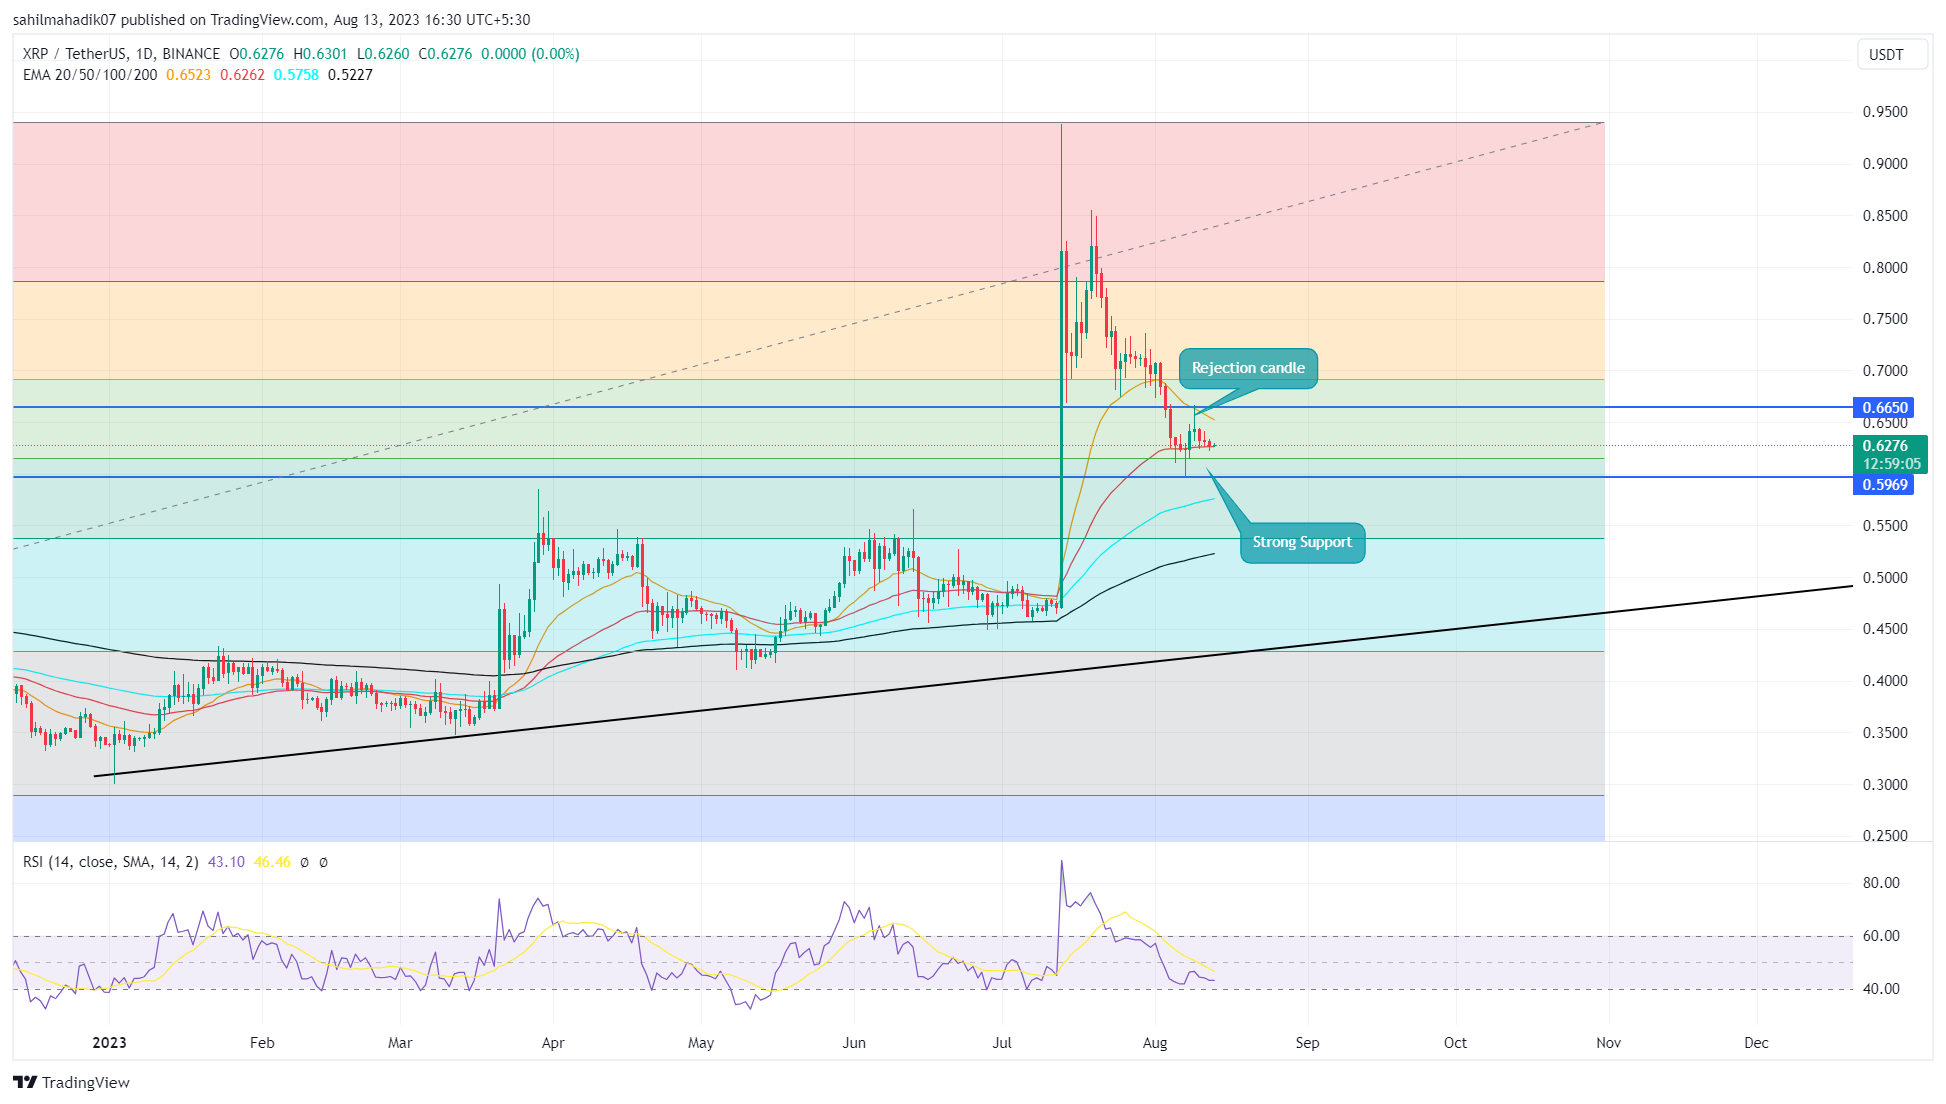
- The XRP buyers can witness strong demand pressure from $0.6 support
- A bullish breakout from the overhead resistance of $0.665 could bolster buyers for 10.8
- The intraday trading volume in the XRP is $504 Billion, indicating a 22.12% loss.
 Source: Tradingview
On August 7th, the XRP price bounced back from the $0.6 support as an attempt from buyers to reclaim higher ground. However, after a short jump of 11.4%, the coin price faced immediate resistance at $0.665.
The rejection candle at this barrier indicates the traders still follow the sentiment of selling on bounces, observed in an established downtrend. The bearish reversal undermined the 6.55% gain of the prior upswing as the XRP price currently trades at $0.627.
The declined price is expected to rechallenge the $0.6 support combined with 50% FIB. In theory, a correction to 0.5% FIB is healthy for a long-term trend whereas a downfall below starts to reflect weakness in bullish momentum.
[embedded content]
Thus, a breakdown below $0.6 could threaten the XRP holders for a major correction.
XRP Buyers Need to Watch Support Level
If the falling XRP price witnesses another surge of buying pressure to $0.6, it would indicate the buyers are accumulating a discounted price. This demand pressure could trigger a sideways action for a few trading days, offering buyers an opportunity to regain strength. Thus a potential breakout from the $0.665 barrier would give the first signal for recovery.
Share this article on:
advertisement
The presented content may include the personal opinion of the author and is subject to market condition. Do your market research before investing in cryptocurrencies. The author or the publication does not hold any responsibility for your personal financial loss.
<!– Close Story–>
- SEO Powered Content & PR Distribution. Get Amplified Today.
- PlatoData.Network Vertical Generative Ai. Empower Yourself. Access Here.
- PlatoAiStream. Web3 Intelligence. Knowledge Amplified. Access Here.
- PlatoESG. Automotive / EVs, Carbon, CleanTech, Energy, Environment, Solar, Waste Management. Access Here.
- PlatoHealth. Biotech and Clinical Trials Intelligence. Access Here.
- ChartPrime. Elevate your Trading Game with ChartPrime. Access Here.
- BlockOffsets. Modernizing Environmental Offset Ownership. Access Here.
- Source: https://coingape.com/markets/xrp-price-analysis-bulls-defend-this-level/

