SNEAK PEEK
- According to recent research, the XRP market is in the bear phase.
- XRP price pulls down as bulls fail to break over intraday resistance.
- During the downturn, the XRP market found support around the 24-hour low of $0.374.
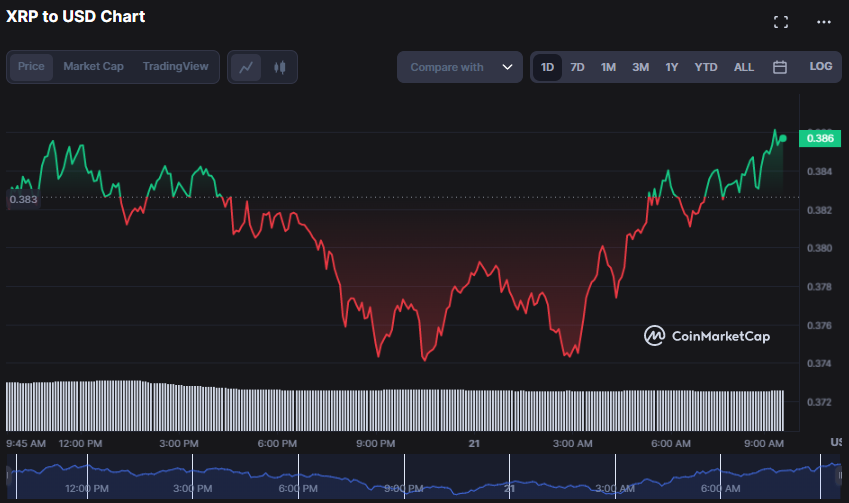
The XRP (XRP) market has been under bearish pressure in the previous 24 hours, with bullish efforts to dominate the market being repeatedly defeated. But, as of press time, bulls had managed to break the trend and push the XRP price to $0.3848, a 0.31% increase from yesterday’s close of $0.3746.
XRP gained support around $0.374 and confronted resistance at the intraday high of $0.3856 during the bull-bear battle.
The market capitalization increased by 0.17% to $19,621,736,999, indicating that traders remain positive on XRP. The 24-hour trade volume, on the other hand, declined by 16.03% to $1,086,871,038, indicating that the recent price rise is due to low trading volumes.
If bulls break over the $0.3856 resistance level, the following resistance levels might be $0.3887 and $0.3918, respectively. If negative pressure continues to dominate the market, support levels may be around $0.3719, $0.3688, and lower at $0.3647.
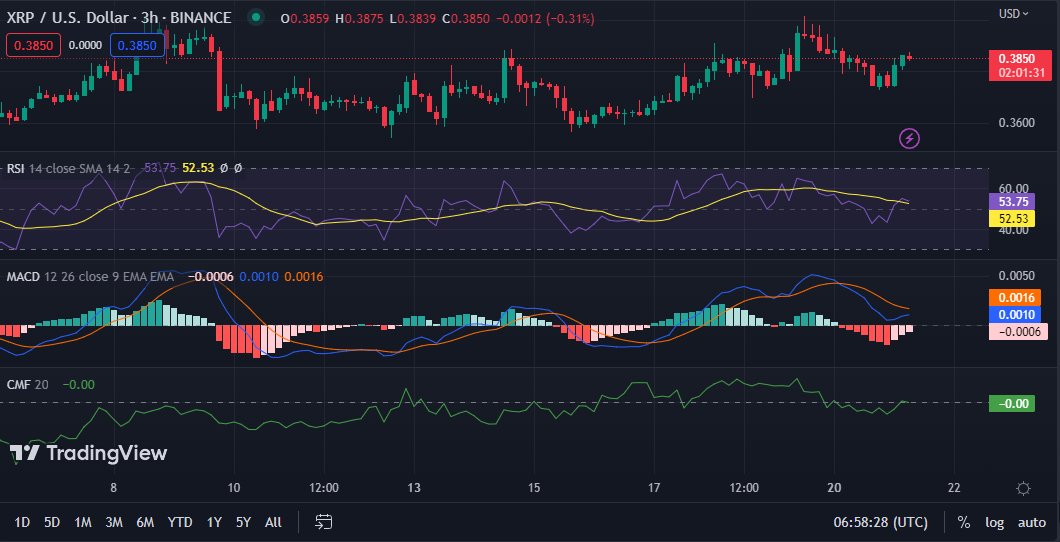
XRP/USD 3-Hour Technical Analysis
The Relative Strength Index (RSI) on the 3-hour price chart rises above the signal line and reads 55.58. The current RSI reading and its upward trajectory indicate buyers are in control of the market; therefore, positive price action is expected in the hours ahead.
On the other hand, negative pressure may rule the market if XRP prices drop below $0.374, their support level.
The market is expected to be dominated by bears, given that the MACD line has dropped below its signal line at a value of 0.0011 and the histogram is trending in negative territory.
This shift suggests the current bullish run may be temporary, and adverse market pressure may soon resume. Buyers may anticipate upward momentum if the MACD rises above the signal line.
With a rating of 0.03 and heading upwards, the Chaikin Money Flow indicator indicates that money is coming into the XRP market and that the bullish trend is expected to continue. As a result, traders should keep an eye out for more price increases as bulls aim to break over $0.3856.
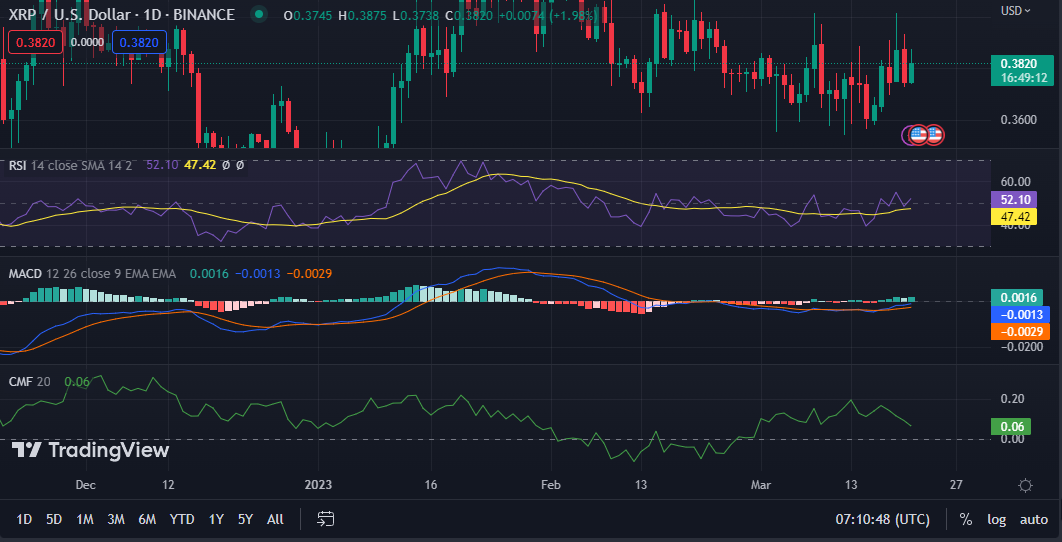
XRP/USD 24-Hour Technical Analysis
The RSI on the 24-hour price chart is 53.29 and points north, indicating that the positive momentum in the XRP market is not over. Bearish pressure may prevail if the RSI fails to continue above 50 and goes below its signal line.
This move reinforces XRP’s bullishness and shows that long-term purchasers should keep their holdings. Short-term traders, on the other hand, should stay cautious and keep an eye out for more market action.
Although in the negative zone, the MACD blue line is advancing above its signal line, with a value of -0.0012 approaching the “0” level. This movement and the histogram trend in the positive zone indicate that the bullish pressure will likely remain in place soon.
As a result, traders could anticipate the XRP price to surge higher if bulls break through the $0.3856 resistance level.
The 24-hour CMF rating of 0.007 indicates that money exits the market, with capital abandoning XRP and transferring to more lucrative assets. This CMF rating and the direction of its movement indicate that traders should be careful and watch for future moves before entering a position.
In conclusion, the XRP market is under bullish pressure, with bulls seeking to break over the $0.3856 resistance level. If successful, more price gains are possible since the bullish pressure will remain in place soon.
Disclaimer: Cryptocurrency price is highly speculative and volatile and should not be considered financial advice. Past and current performance is not indicative of future results. Always do your own research and consult with a financial advisor before making investment decisions.
- SEO Powered Content & PR Distribution. Get Amplified Today.
- Platoblockchain. Web3 Metaverse Intelligence. Knowledge Amplified. Access Here.
- Source: https://investorbites.com/xrp-price-analysis-21-3/

