SNEAK PEEK
- XRP market is in a significant downtrend, signalling potential profit-taking or short-selling opportunities.
- The market is under intense selling pressure, but a price reversal may occur soon.
- XRP oversold and is due for a brief bounce, despite adverse market indicators.
The bears have dominated the XRP market over the past 24 hours, driving the price from an intraday high of $0.5469 to an intraday low of $0.5136. This decline proves that bears have recently controlled the market, driving down costs.
At the time of writing, persistent bearish pressure had caused the price to fall from 3.87% to $0.5151. The increased selling pressure in XRP results from investors who stand to gain from the price increase and are cashing out on their gains due to this decline.
Due to the recession, the market capitalization decreased by 3.85% to $26,533,527,989, and the 24-hour trading volume decreased by 19.54% to $1,828,036,205. This decline can be attributed to investors’ uncertainty and caution as they closely monitor the XRP market and postpone making significant investments until they observe a recovery.

The upper and lower values of the Kelter Channels (KC) are 0.5613 and 0.4918, respectively, on the XRP market. Based on this movement, the market is in a significant downtrend. It may signal continued downward momentum and present opportunities for profit-taking or short-selling if the price movement breaks through the bottom line.
The Commodity Channel Index (CCI), which is negative, with its line facing South, has a value of -177.23 on the 4-hour price chart of the XRP market. This movement suggests that the market is under intense selling pressure and that a price reversal will probably occur soon. XRP is now less expensive, but a price increase might appear soon.

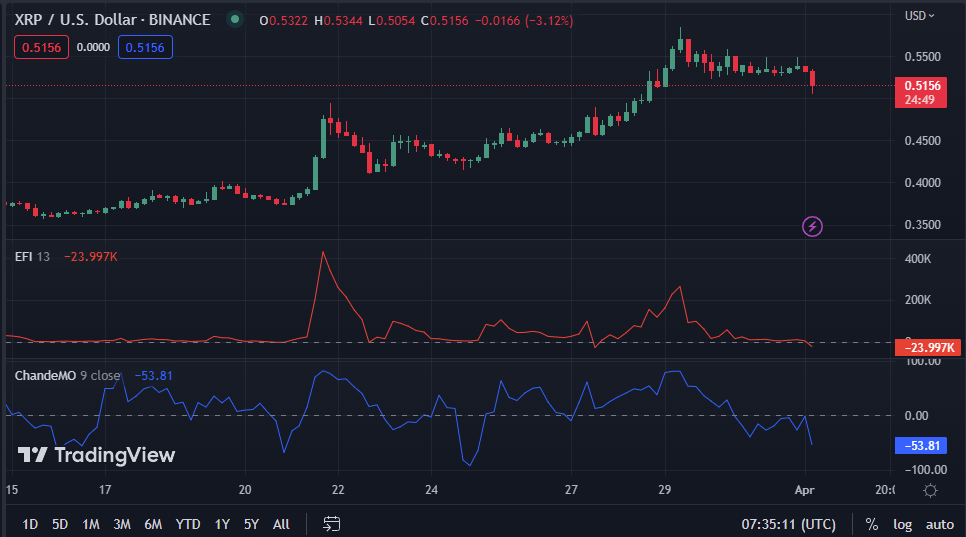
The Chande Momentum Oscillator (ChandeMO) on the 4-hour price chart is a south-facing, negative oscillator with a value of -53.29. Recently, the asset’s price has been dropping quickly on the market. This motion suggests the asset may be due for a brief bounce because it is currently oversold.
The Elder Force Index (EFI) on the XRP market’s 4-hour price chart is negative, with a value of -23.997k, showing more selling pressure in the market, which could indicate the beginning of a bearish trend. Although the cost of XRP has decreased, a significant price increase may be on the horizon.
In conclusion, while XRP’s recent bearish trend may cause concern, indicators suggest a potential rebound in the near future, making it a prime opportunity for investors.
Disclaimer: Cryptocurrency price is highly speculative and volatile and should not be considered financial advice. Past and current performance is not indicative of future results. Always research and consult with a financial advisor before making investment decisions.
- SEO Powered Content & PR Distribution. Get Amplified Today.
- Platoblockchain. Web3 Metaverse Intelligence. Knowledge Amplified. Access Here.
- Source: https://investorbites.com/xrp-price-analysis-1-4/

