- The 7-week decline of -23% in WTI crude oil has started to stabilize in the last two days.
- The recent rebound of +8% from last Friday, 17 November low has been driven by anticipation of an extension of oil supply cuts into 2024 by OPEC+.
- Watch the US$75.60 key short-term support in WTI crude oil.
In the past four weeks, oil prices have been hammered to the downside due to waning external global demand as the past year of tight monetary policies enacted by developed nations’ central banks (except Japan) have started to show negative trickle-down effects on the real economy.
In addition, the geopolitical risk premium has remained status quo as the ongoing Israel-Hamas conflict has not triggered a wider negative repercussion in the Middle East region at this juncture since the start of the hostilities on 7 October 2023.
The price actions of West Texas Oil (a proxy of WTI crude oil futures) have tumbled by -23% from its 28 September 2023 high of US$95.50/barrel to last Thursday, 16 November low of US$72.68/barrel.
Bears have managed to stall at a key medium-term support
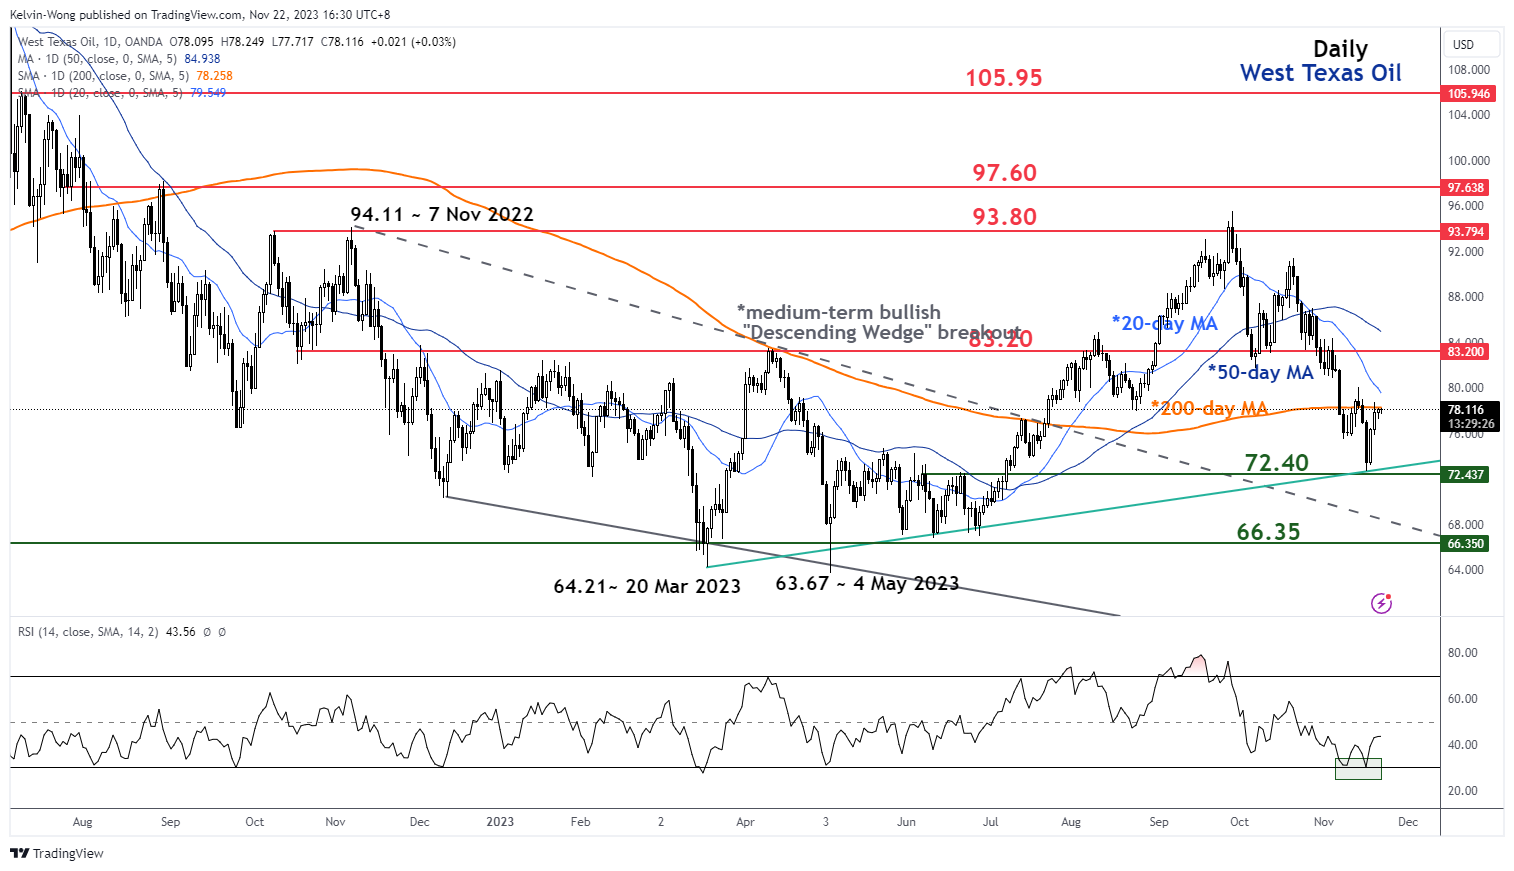
Fig 1: West Texas Oil medium-term trend as of 22 Nov 2023 (Source: TradingView, click to enlarge chart)
Interestingly, the seven-week decline seen in West Texas Oil has managed to stall at the US$72.40 key medium-term support which is defined by the ascending trendline in place since the 20 March 2023 low, congestion zone of 7 June/21 June 2023 and the 76.4% of the Fibonacci retracement of the prior medium-term uptrend from 4 May 2023 low to 28 September 2023 high; a confluence of different elements leading to similar price level.
Thereafter, it managed to stage a significant rebound of +8.3% to print an intraday high of US$78.75 on Monday, 20 November before it traded sideways.
The current bout of optimism in oil prices has been driven by built-up anticipation that OPEC+ members are likely to extend the current quantum of supply cuts into 2024 or even the possibility of deeper cuts when the cartel group meets this Sunday, 26 November.
Retesting its 200-day moving average
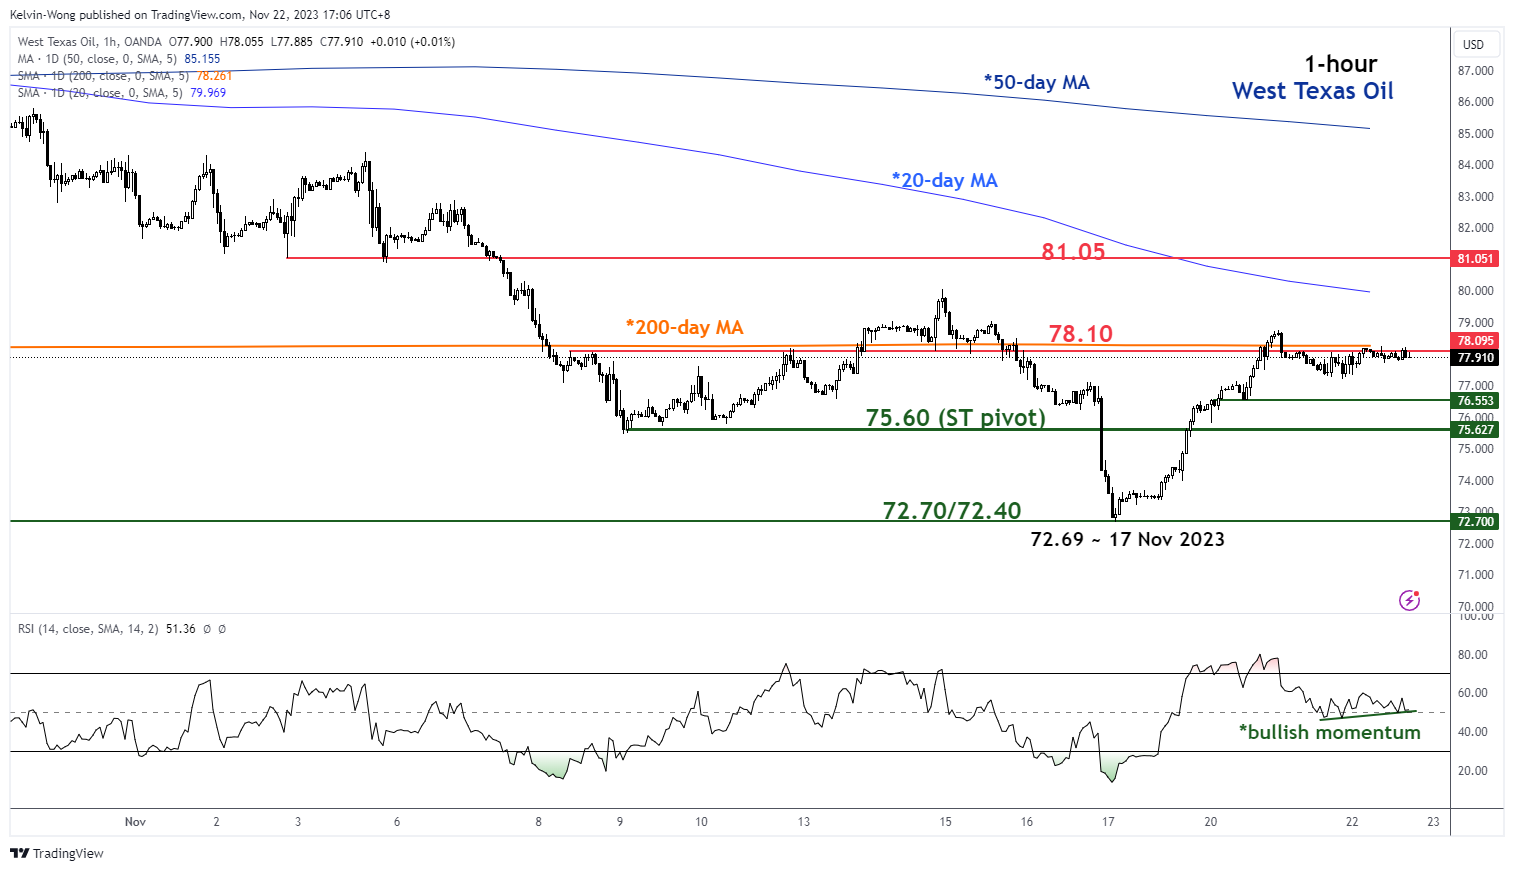
Fig 2: West Texas Oil minor short-term trend as of 22 Nov 2023 (Source: TradingView, click to enlarge chart)
As seen in the shorter-term 1-hour chart, the price actions of West Texas Oi have traded in a narrow sideway range of 1% since yesterday, 20 November after a retest on the 200-day moving average now acting as a near-term resistance of US$78.10.
The hourly RSI momentum indicator has continued to hold above the 50 level which suggests a potential bullish momentum reading at least in the short term.
Watch the US$75.60 key short-term pivotal support and clearance above the 200-day moving average (US$78.10) may see the next intermediate resistance coming in at US$81.05.
On the other hand, failure to hold at US$75.60 exposes the key medium-term support zone of US$72.70/72.40.
Content is for general information purposes only. It is not investment advice or a solution to buy or sell securities. Opinions are the authors; not necessarily that of OANDA Business Information & Services, Inc. or any of its affiliates, subsidiaries, officers or directors. If you would like to reproduce or redistribute any of the content found on MarketPulse, an award winning forex, commodities and global indices analysis and news site service produced by OANDA Business Information & Services, Inc., please access the RSS feed or contact us at [email protected]. Visit https://www.marketpulse.com/ to find out more about the beat of the global markets. © 2023 OANDA Business Information & Services Inc.
Latest posts by Kelvin Wong (see all)
- SEO Powered Content & PR Distribution. Get Amplified Today.
- PlatoData.Network Vertical Generative Ai. Empower Yourself. Access Here.
- PlatoAiStream. Web3 Intelligence. Knowledge Amplified. Access Here.
- PlatoESG. Carbon, CleanTech, Energy, Environment, Solar, Waste Management. Access Here.
- PlatoHealth. Biotech and Clinical Trials Intelligence. Access Here.
- Source: https://www.marketpulse.com/commodities/wti-oil-technical-recent-plunge-seems-to-have-found-a-floor-ahead-of-opec/kwong

