The below is an excerpt from a recent edition of Bitcoin Magazine Pro, Bitcoin Magazine’s premium markets newsletter. To be among the first to receive these insights and other on-chain bitcoin market analysis straight to your inbox, subscribe now.
CPI Volatility Doesn’t Disappoint
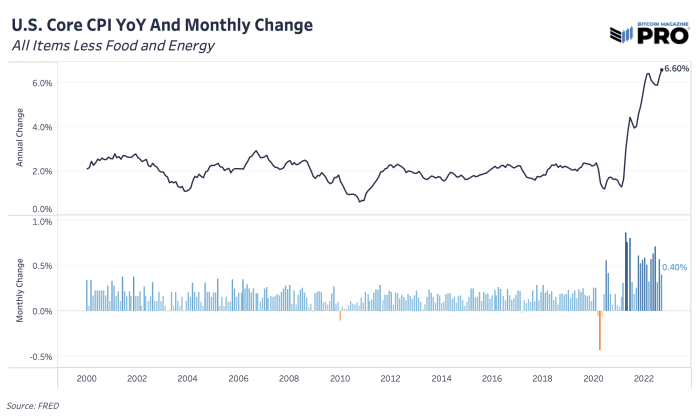
In the last article, we highlighted a potential for CPI to surprise to the upside and bring more volatility — and that’s exactly what we got and more. We won’t cover the components that drove the surprise in detail since we already highlighted much of that, but the key takeaway is that Core CPI came in hotter than expected at 6.6% year-over-year and 0.4% month-over-month with shelter (rent, housing components, etc) and medical services as key drivers. This is the fastest rate of change in annual headline Core CPI since 1982. To compare the various components over the last three months, check out this chart.
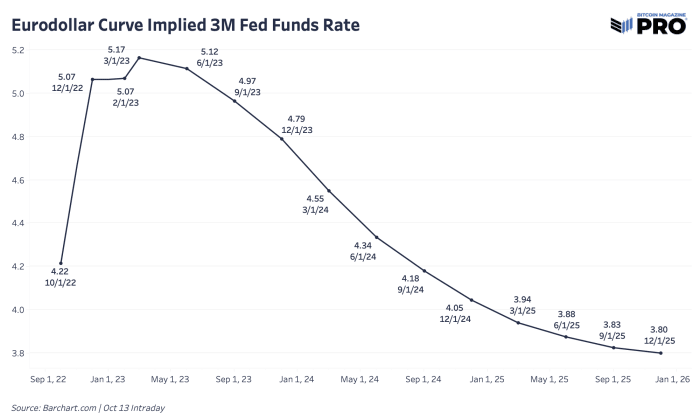
As for the rates, the latest implied federal funds rate from the eurodollar market shows a peak just above 5% in March 2023 before any rate cuts happen at the end of the year.
Where’s The Bitcoin Price Low?
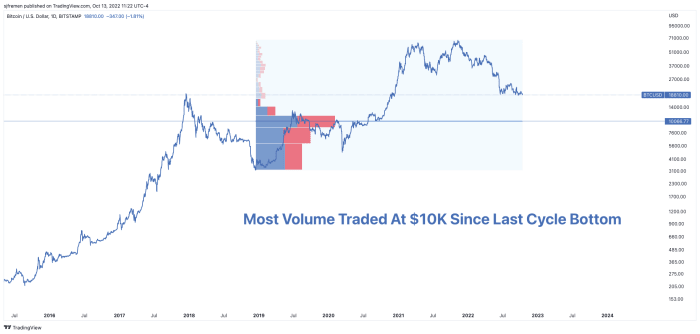
With a fall to $18,000 inching closer and bitcoin facing risks of new year-to-date lows, it’s worth taking a look at a few key bottom price levels to gauge where the price may end up. First, let’s look at the fixed volume range profile of bitcoin since the December 2018 bottom of last cycle. The overwhelming majority of traded volume in the market occurred right around $10,000, also a key psychological level. In a strong downward move, $10,000 is a place where many in the market have their spot cost basis and could start feeling some real drawdown pain or lack of conviction.
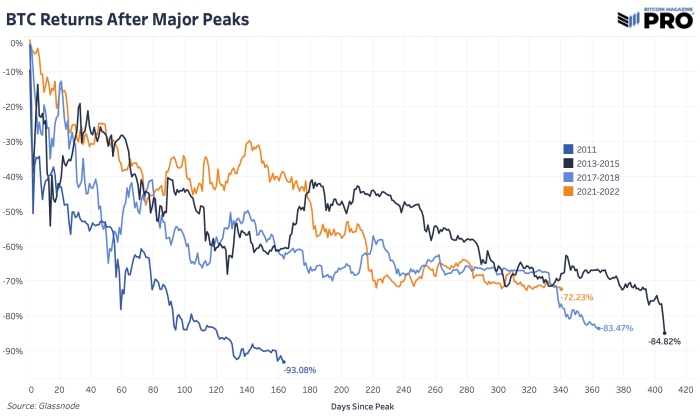
In terms of bear market and cycle duration, let’s revisit the cyclical drawdown chart for bitcoin in current and previous cycles. Currently, we’re right around a 72.23% drawdown from an all-time high closing price of $67,589. If we are going to see a max cycle drawdown come in less than the last two cycles — let’s say around 80% — then we’re looking at a price around $13,500. If we assume that this cycle and popping of valuations will be much worse, let’s say around 85%, then we’re looking at a price around $10,100. The bull case is that we’ve found a durable bottom at $18,000 and we won’t see the max drawdown reach beyond 73%.
From an on-chain perspective, one of the more interesting realized price areas is the realized price held by the cohort of addresses that have 10-100 BTC. Recall that realized price is an estimate of the average cost basis based on the price when UTXOs last moved. This particular group accounts for around 22.6% of all circulating supply. This group would certainly reflect a decent portion of long-term holders and there’s a case to be made that in a deep, prolonged bear market, long-term holders have yet to feel the pain or capitulation that we’ve seen in the past.
Relevant Past Articles: