Talking Points:
- Why did gold prices decline sharply?
- Daily Chart Analysis
- 4-Hour Chart Analysis
- What’s next for Gold Prices?
Why did gold prices decline sharply?
Gold Price fell significantly last week after reaching an all-time high of $2150/Oz, the price fell to $2020/Oz within a day which left many traders stunned and unable to comprehend what has happened, and the more difficult question remains unanswered, what’s next for Gold Prices? Over the past few weeks/months, inflation has been in a downtrend in all the major economies globally, this kept the markets divided on how the FOMC and other major central bank’s next move will be regarding Interest rates.
Markets are convinced to a certain extent that the FOMC will end up having to cut rates in 2024 and the speculation around the number of rate cuts kept traders on edge, on the other hand, the Central Bank officials continue their hawkish interest rate tone, but markets are not fully listening with some traders go as far as expecting a 75-basis point rate but by mid-2024. Traders learned over the years that the phrase “Don’t fight the FED” remains in full effect, however, historically but to a much lesser extent, it has happened before when markets were ahead of the FED.
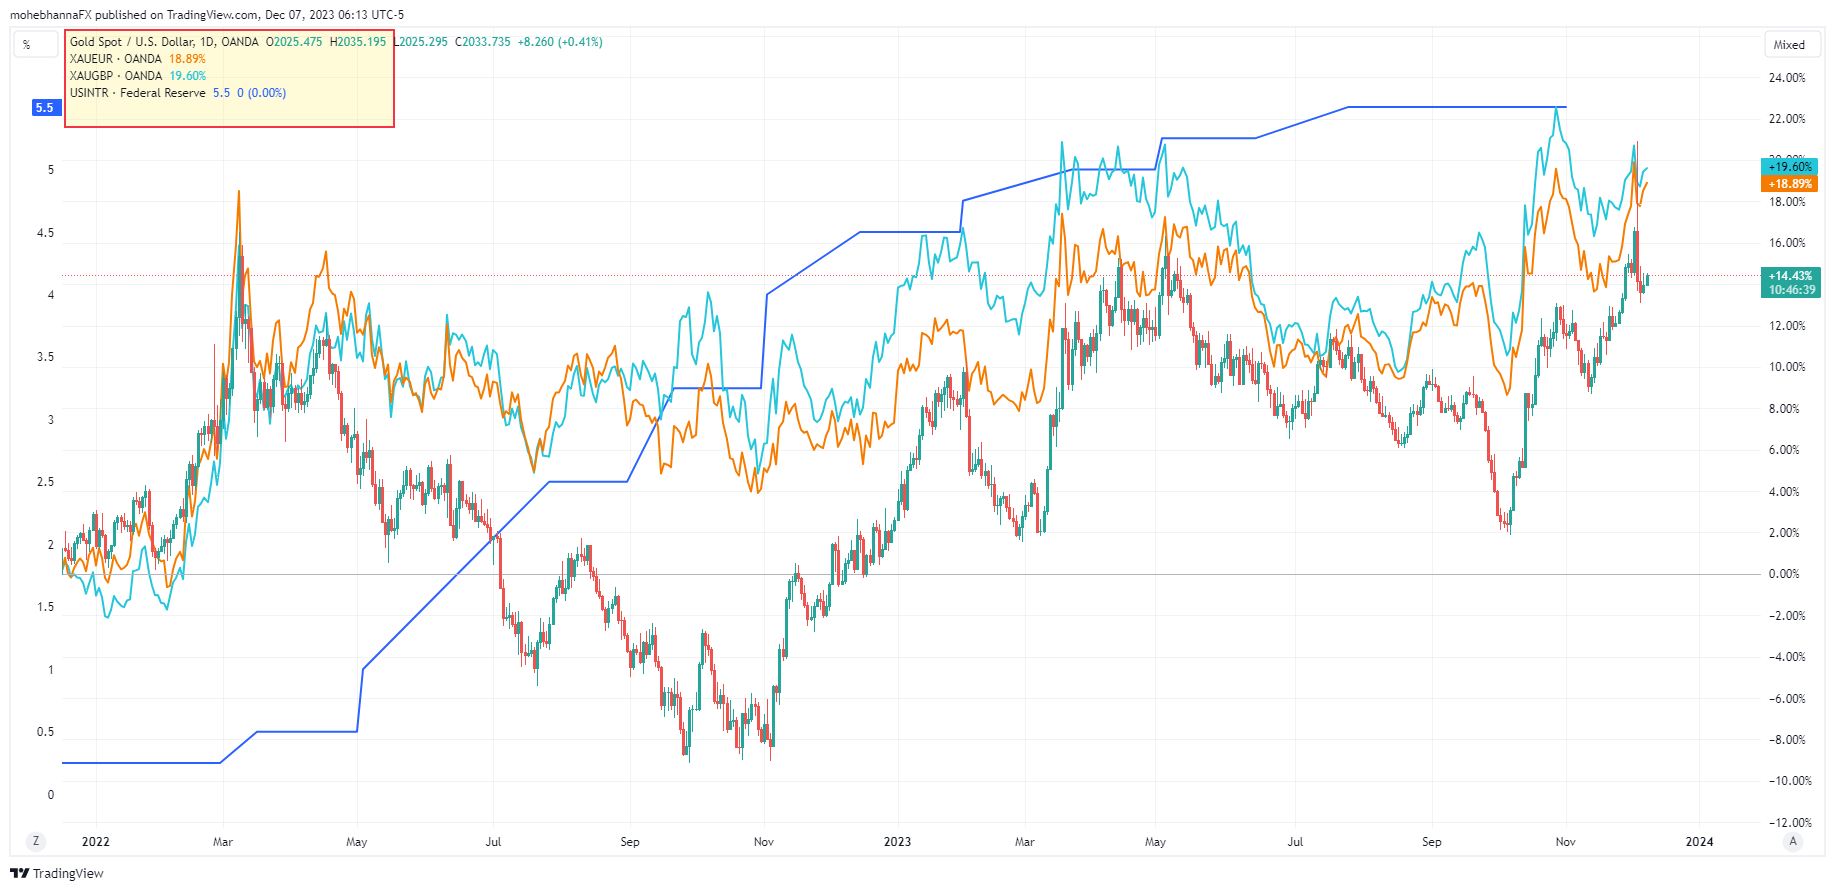
The above chart is for XAUUSD with XAUEUR and XAUGBP overlay on the same percentage scale, the latest price move on the three instruments is almost the same which indicates that interest rate speculation on USD was most likely the main reason for the recent decline in gold prices, the same chart also includes USA interest rates overlay on the left percentage scale reflecting the recent gold price action compared to interest rates on the Dollar since the FED began raising interest rates.
Daily Chart Analysis
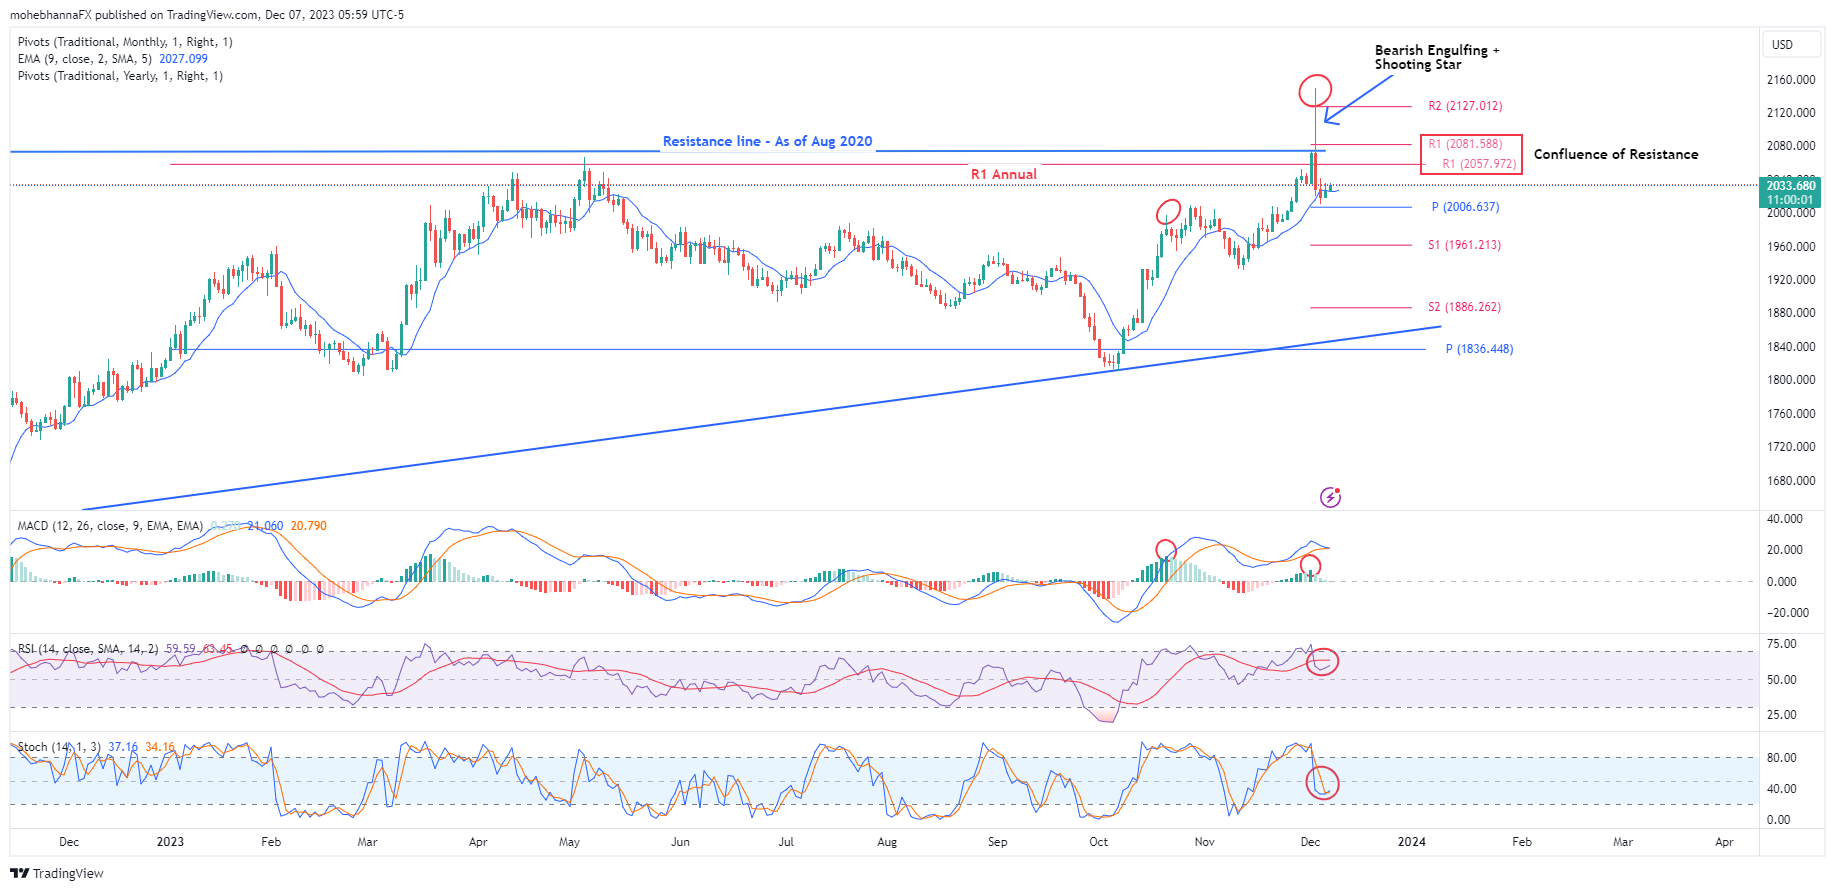
- Price attempted to break above the horizontal trendline connecting gold price’s all-time highs since August 2020, a significant failure represented by a high range, bearish engulfing, and shooting star candlestick pattern which took the price from its peaks of $2150/OZ range back down to $2020/OZ.
- Price broke below an annual support which has now turned into a resistance, the price range between $2081.59 and $2057.97 currently represents a confluence of resistance represented by the annual and monthly R1 as well as previously mentioned trendline connecting historic highs.
- The declining price action has found support so far above the annual pivot point of $2006.64, the price action is also attempting to remain above its Non-Smoothed EMA9 (Offset by 2), if price action fails to hold, breaks, and closes below these levels, it may result in further declines.
- Stochastic and RSI default settings continue to follow price action and are not generating any signals, however, both oscillators are attempting to break above their averages but are yet to materialize.
- The MACD line is moving closer to its signal line and attempting to break below, a slight negative divergence between price action and MACD Histogram can be identified.
4-Hour Chart Analysis
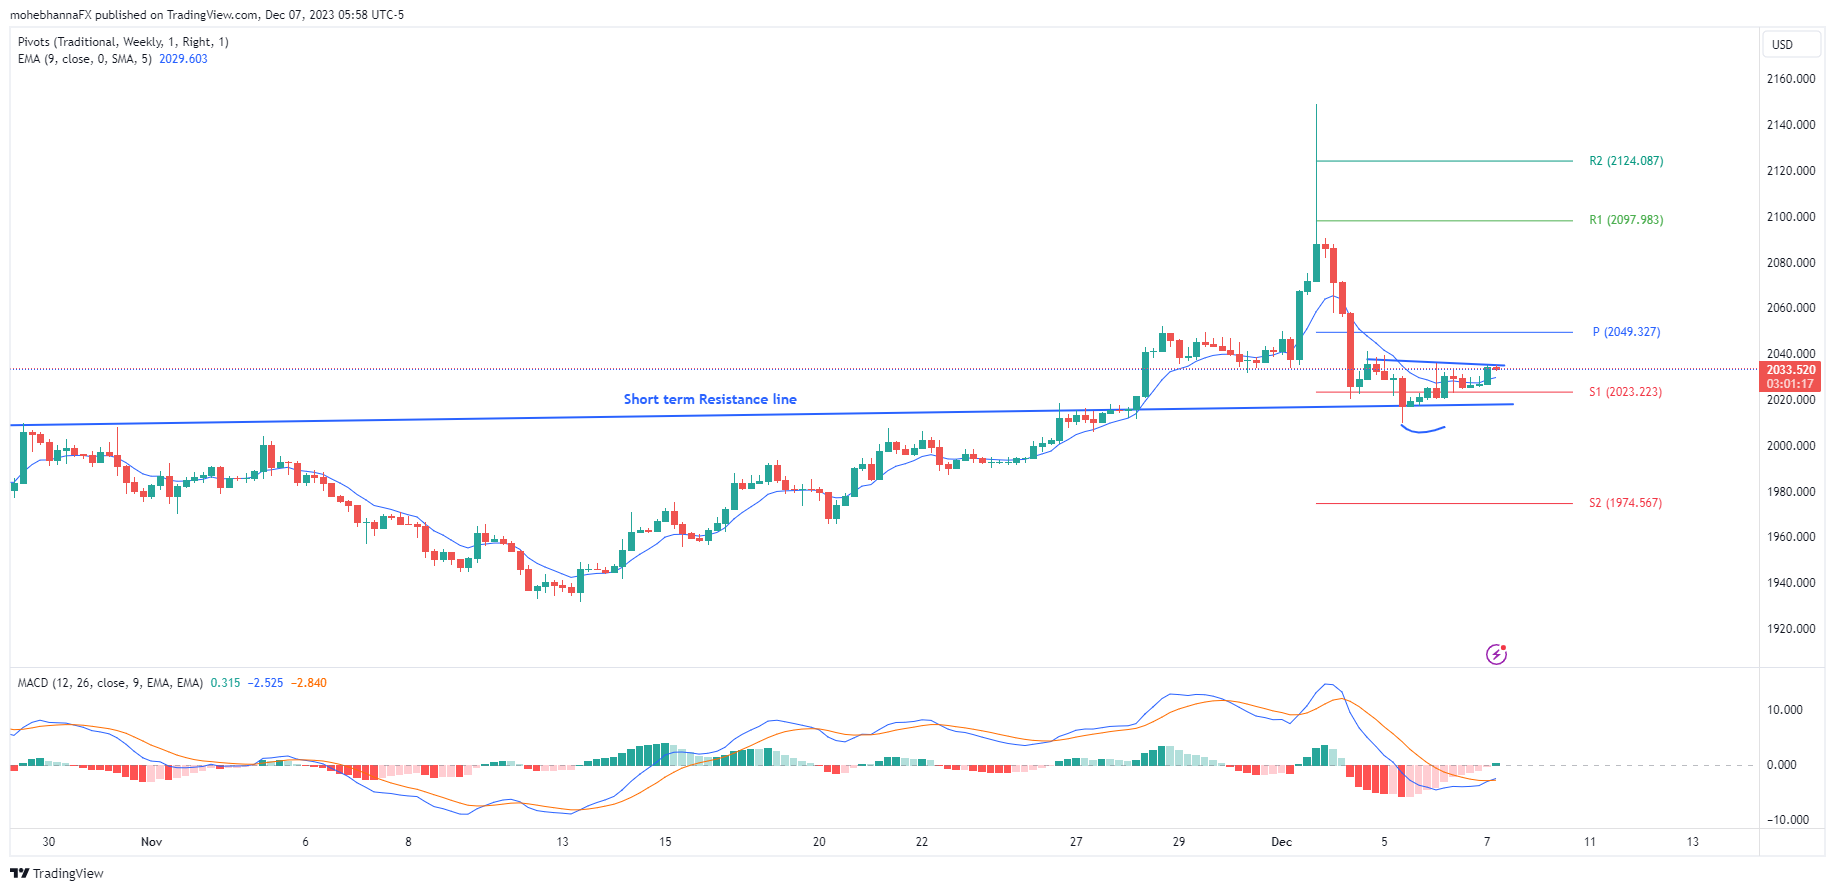
- An inverted Head and Shoulder as price action attempts a reversal after the recent decline. If the pattern materializes, price action may reach the weekly pivot at $2049.32, however, if the pattern fails, a break below the identified short-term resistance line and the Support level S1 near $2023.22, may open the way for the price to follow the path of least resistance.
- Price is so far trading above its fast non-smoothed EMA, a break and a close below the respective EMA9 may keep price action under pressure.
- MACD is in line with price action, currently the MACD line is attempting to cross above its signal line, a false MACD cross along with a failed H&S pattern may also add pressure to the price decline.
What’s next for Gold Prices?
We do have multiple significant levels to watch for, a break and a close below the EMA9 may allow the price to decline further to its monthly PP at $2006.63, the respective support level below that would be S1 at $1961 and S2 at $1886.26. On the other hand, a break and a close above the confluence of resistance identified on the charts may open the way for further upside price action. The patterns and price action on shorter time frames can help identify potential next moves. On the shorter time frame, the 4-hour chart, the weekly critical levels are S1 at $2023.22, S2$1974, R1 at $2097.98, and R2 at $2124.08.
Read More on Market Pulse:
Gold Technical: Medium-term uptrend remains intact but risk of minor pull-back
US jobs data eyed ahead of next week’s Fed rate decision
FOMC Meeting Minutes – A Technical Analysis Approach for EURUSD – USDJPY
Content is for general information purposes only. It is not investment advice or a solution to buy or sell securities. Opinions are the authors; not necessarily that of OANDA Business Information & Services, Inc. or any of its affiliates, subsidiaries, officers or directors. If you would like to reproduce or redistribute any of the content found on MarketPulse, an award winning forex, commodities and global indices analysis and news site service produced by OANDA Business Information & Services, Inc., please access the RSS feed or contact us at [email protected]. Visit https://www.marketpulse.com/ to find out more about the beat of the global markets. © 2023 OANDA Business Information & Services Inc.
Latest posts by Moheb Hanna (see all)
- SEO Powered Content & PR Distribution. Get Amplified Today.
- PlatoData.Network Vertical Generative Ai. Empower Yourself. Access Here.
- PlatoAiStream. Web3 Intelligence. Knowledge Amplified. Access Here.
- PlatoESG. Carbon, CleanTech, Energy, Environment, Solar, Waste Management. Access Here.
- PlatoHealth. Biotech and Clinical Trials Intelligence. Access Here.
- Source: https://www.marketpulse.com/gold/gold-prices/whats-next-for-gold-price-xau-usd-technical-analysis/mhanna

