Executive Summary
- Bitcoin prices are infamously volatile, however the market is currently experiencing an extreme volatility compression. Fewer than 5% of trading days have a tighter trade range.
- Futures markets are notably flat, with trade volumes for BTC and ETH both probing all-time-lows, and cash-and-carry yields of 5.3% just slightly above the risk free rate.
- Implied volatility in options markets is undergoing a significant volatility crush, with volatility premiums trading at less than half the 2021-22 baseline.
- Both the put/call ratio, and the 25-delta skew metrics are at all-time-lows, suggesting options markets favour calls, and put options have priced in very light volatility ahead.
A Quiet Patch
Bitcoin markets are experiencing an incredibly quiet patch, with several measures of volatility collapsing towards all-time lows. In this edition, we will explore just how remarkable this quiet period is from a historical standpoint, and then explore how this is being priced into derivatives markets.
To set the scene, we note that the BTC spot price is trading above a number of long-term moving averages (111D, 200D, 365D and 200W) which are widely observed across the industry. These averages range from a low of $23.3k (200DMA) up to $28.5k (111DMA). This chart also highlights similar periods over the past two cycles which tend to align with macro uptrends.

We can see a very similar context using on-chain realized prices which model the cost basis for three cohorts:
- 🟠 Entire market (the realized price).
- 🔴 Short-Term Holders (coins younger than 155-day).
- 🔵 Long-Term Holders (coins older than 155-day).
The spot price is again trading above all three models and demonstrates a strong confluence with the classic technical analysis tools above.

It has been 842-days since the bull market peak was set in April 2021 (see note below). The 2023 recovery is actually faring somewhat better than the last two cycles, trading -54% below the ATH, compared with -64% historically.
We also note that both the 2015-16 and 2019-20 cycles experienced a 6-month period of sideways boredom before the market accelerated above the -54% drawdown level. This is perhaps an indication of the boredom which may lie ahead.
Note: we proposed the idea that the May 2021 sell-off was in fact the start of bear market sentiment from observing bearish divergences in WoC 4-22 and WoC 8-22.

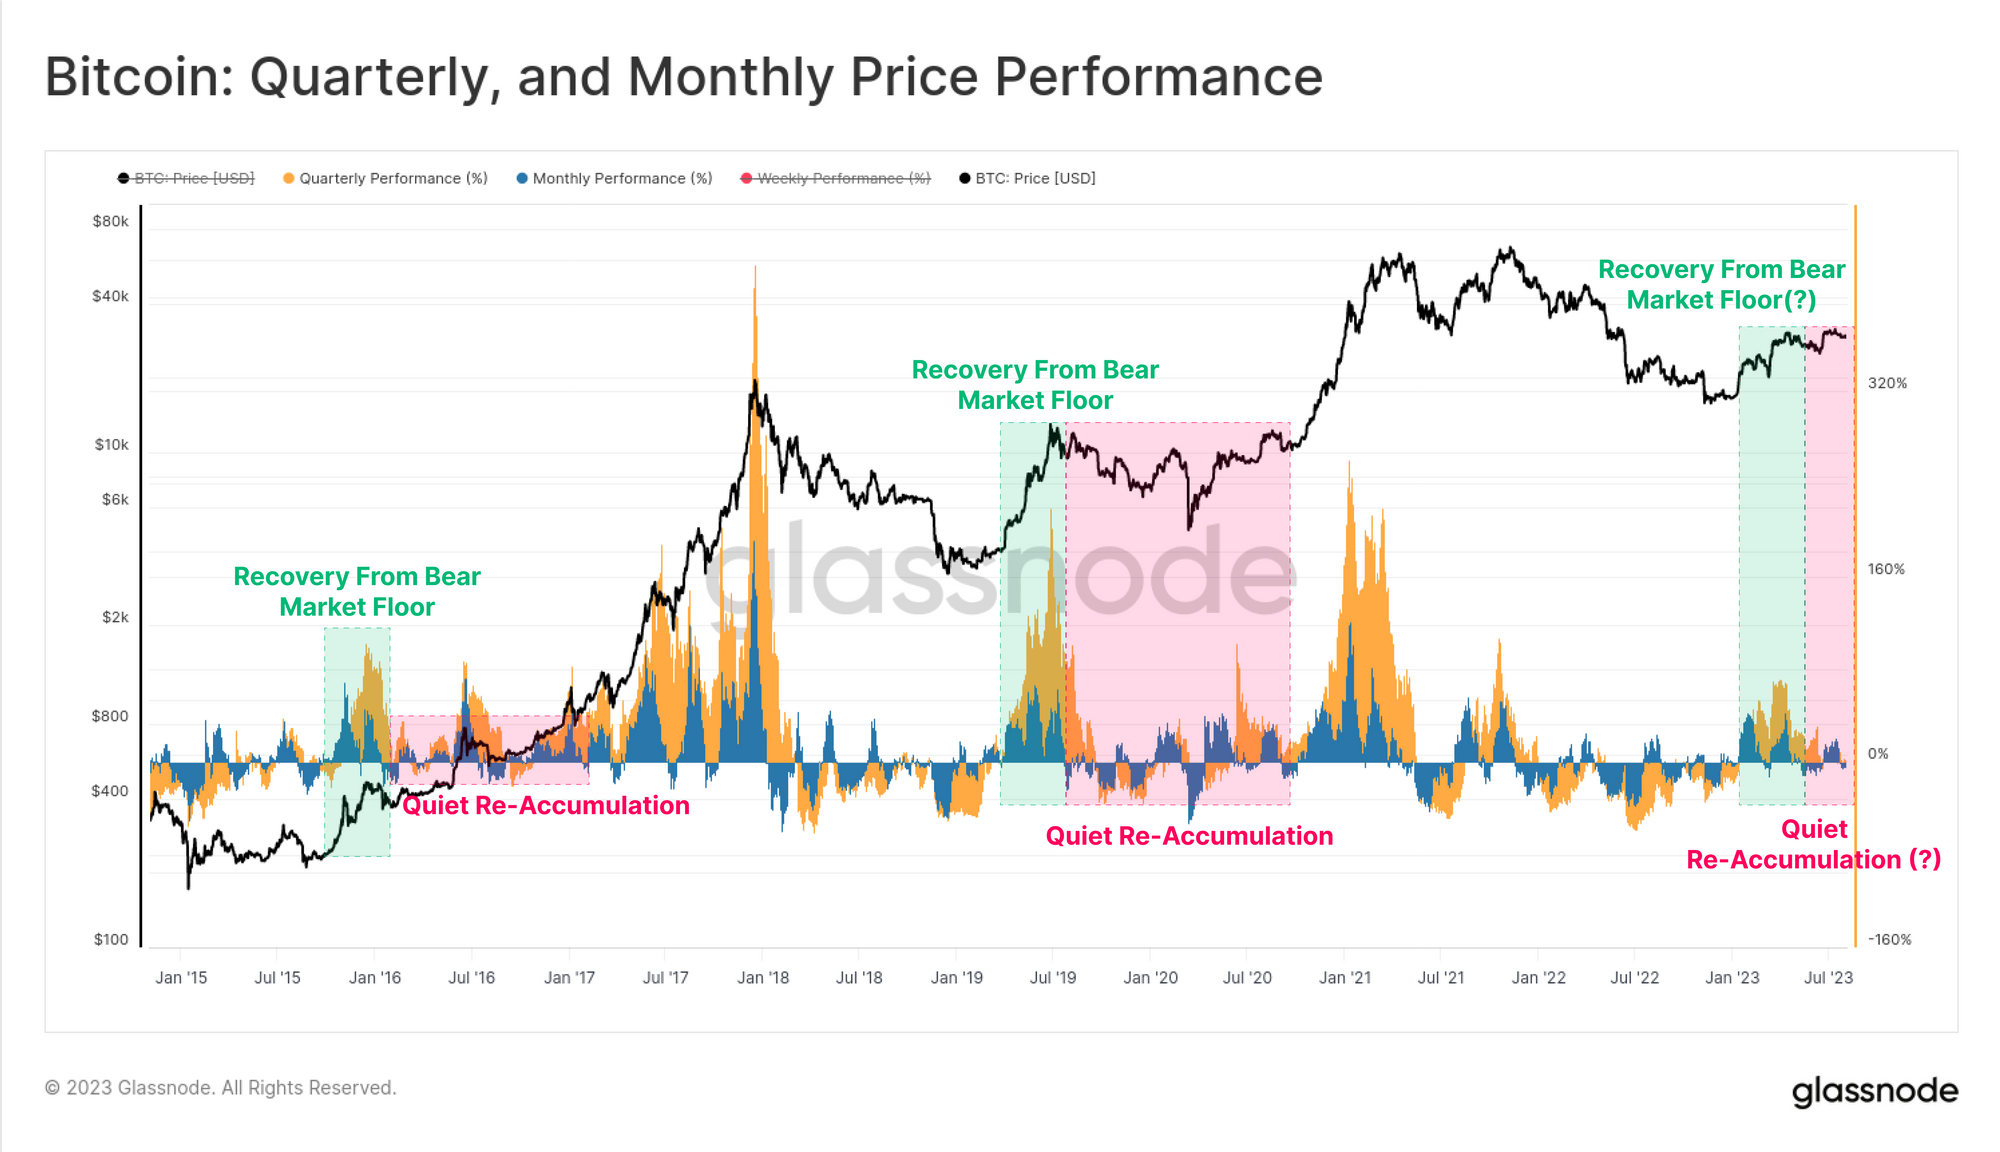
After a blazing hot start to 2023, both the quarterly and monthly price performance has cooled off. We can again see many similarities to prior cycles where the initial rally off the bottom is powerful, but leads into an extended period of choppy consolidation.
This period is often referred to as the re-accumulation period by Bitcoin analysts.
Volatility Collapses
Bitcoin realized volatility ranging from 1-month to 1-year observation windows has fallen dramatically in 2023, reaching multi-year lows. The 1y volatility window is now at levels not seen since December 2016. This is the fourth such period of extreme volatility compression:
- The late stage 2015 bear into the 2016 re-accumulation period.
- The late stage 2018 bear which preceded a 50% sell-off in Nov. This was however followed by the Apr 2019 recovery rally, rising from $4k to $14k over three months.
- Post March 2020 consolidation as the world adjusted to the outbreak of COVID-19.
- The 2022 end of year break as the market digested the FTX failure, and our current market (see WoC 2-23 for our analysis in January 2023).

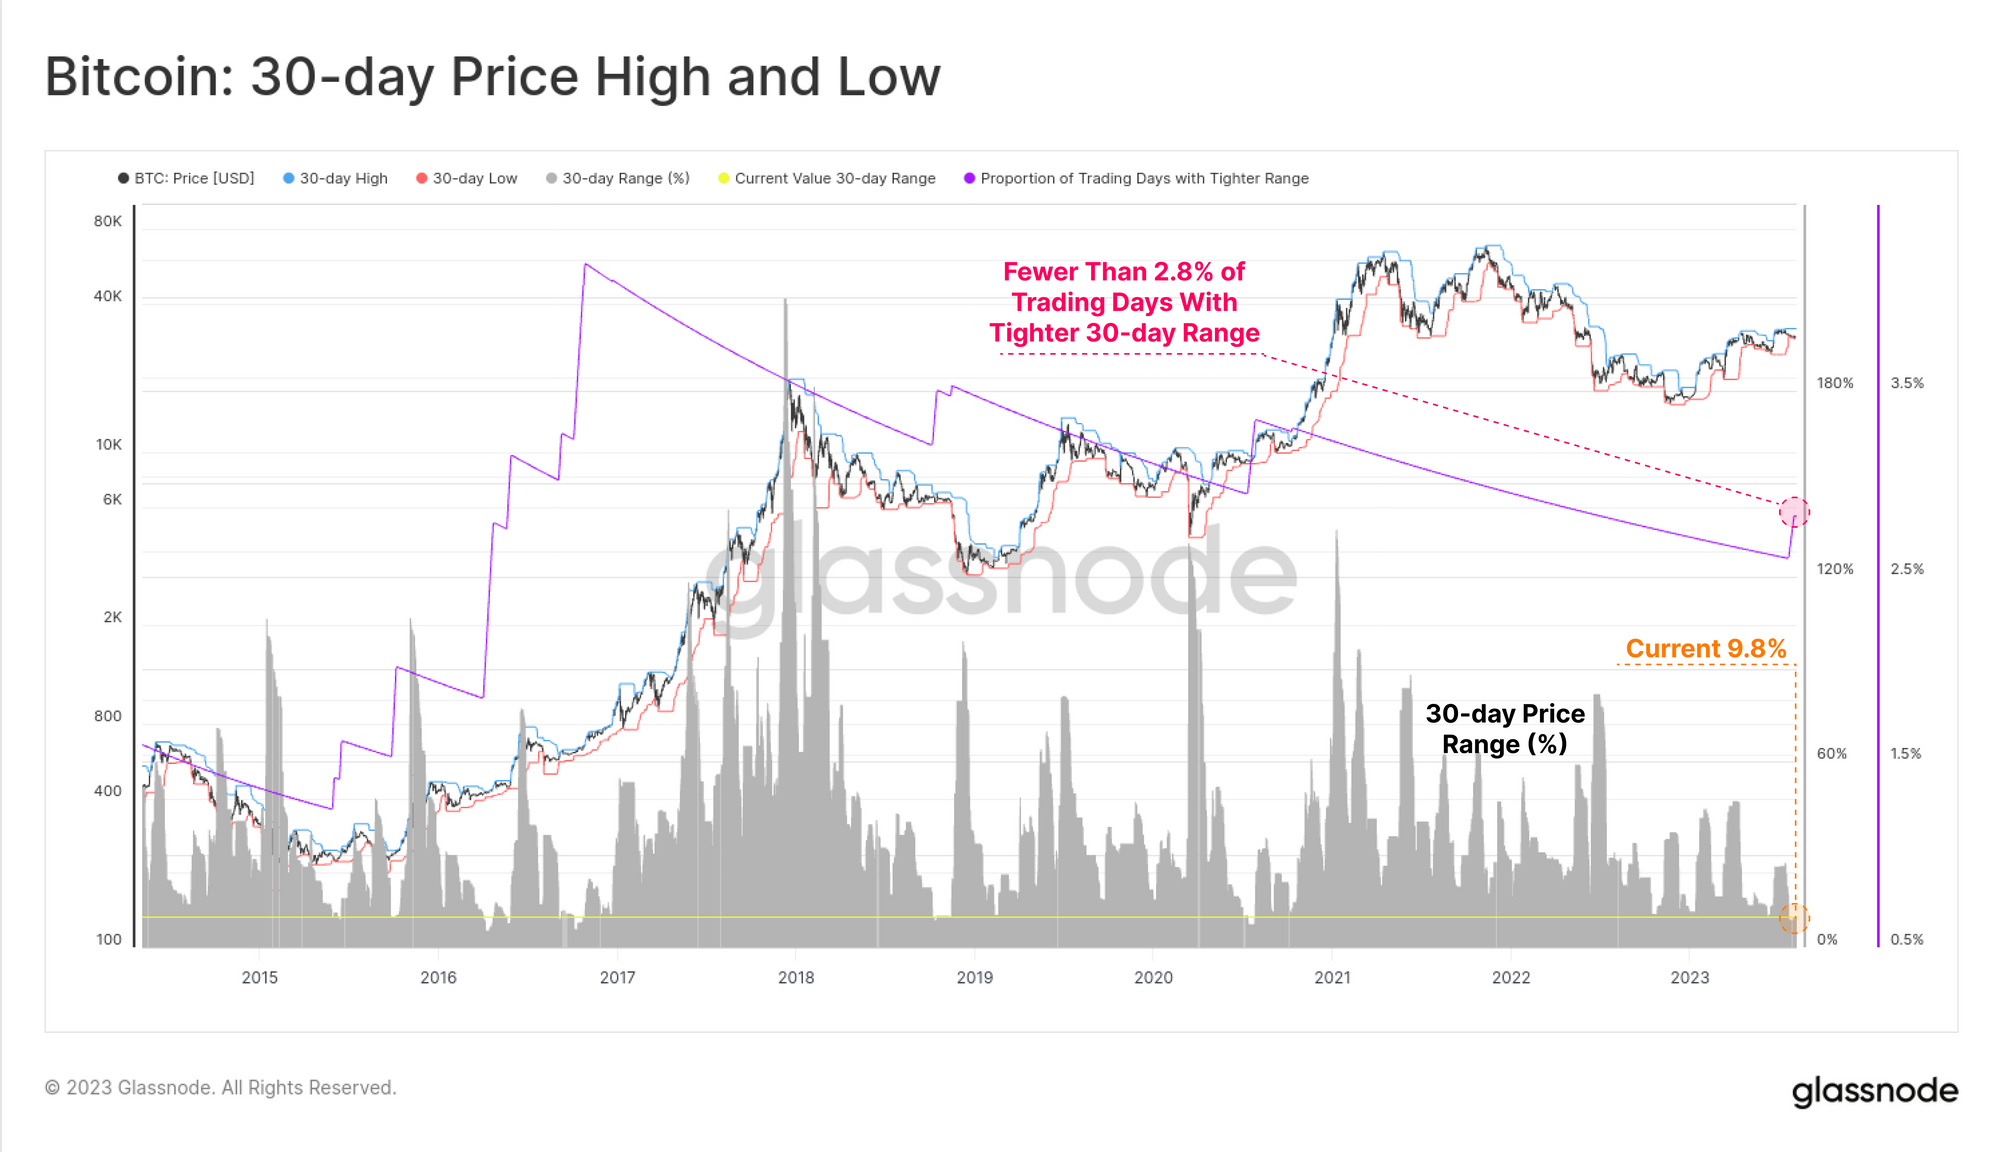
The price range which separates the 7-day high and low is just 3.6%. Just 4.8% of all trading days have ever experienced a tighter weekly trade range.

The 30-day price range is even more extreme, constricting price to just a 9.8% band over the last month, and with only 2.8% of all months being tighter. Periods of consolidation and price compression at this magnitude are extremely rare events for Bitcoin.
Futures Flatten Out
This quiet spell is also visible across derivatives markets for both BTC and ETH. The combined Futures and Options trade volume for the two assets are at, or approaching all-time-lows for Ethereum and Bitcoin, respectively.
BTC is currently seeing $19.0B in aggregate derivatives trade volume, whilst ETH markets have just $9.2B/day, taking out the Jan-2023 lows.

The market is also maintaining a relatively risk off stance, with Bitcoin dominance within futures markets grinding slowly higher. Throughout 2021-22, Ethereum futures markets experienced a steady increase in both trade volume and open interest relative to Bitcoin, peaking at a 60 BTC : 40 ETH split in H2-2022.
This year has seen the scales tilt back in favour of Bitcoin, suggesting lighter liquidity and a reduced risk appetite remains a force moving capital up the risk curve.

Open interest Bitcoin in futures markets has also been relatively flat at $12.1B over the last month. These are similar levels to the second half of 2022 when prices were ~30% cheaper than today and the FTX exchange was still active. It is also similar to during the Jan-2021 run-up when prices were 30% higher, the market was less mature, and leveraged speculation was only just heating up.

On a comparative basis, Options markets have seen a significant uptick in dominance and growth, with open interest more than doubling over the last 12-months. Options now rival futures markets in terms of open interest magnitude.
Futures open interest on the other hand has been in steady decline since late 2022 (when FTX collapsed), and has only seen a slightly increase in 2023.

Implied Volatility Crush
With so little trade volume and lacklustre activity in futures markets, the next goal is to identify which opportunities are keeping traders active in the digital asset derivatives space.
In futures markets, the term structure indicates that an annualized yield of between 5.8% and 6.6% is available via a cash-and-carry strategy. This however is only a very slight premium over yields available in short-term US Treasury Bills, or money market funds.

Perpetual swap markets are by far the most liquid trading venue for digital assets, and traders and market makers can lock in a funding rate premium to arbitrage the futures and spot prices. This form of cash-and-carry is more volatile and dynamic, but currently yields a more attractive 8.13% annualized to account for this additional risk.
Of note is the sustained positive uptick in funding rates since January, signalling a marked change in sentiment since late 2022.

Moving across to options markets, and we can see just how severe the volatility crush has been, with implied volatility across all contract expirations collapsing to all-time lows.
Bitcoin markets are infamously volatile, with options trading at an implied volatility between 60% to over 100% for the majority of 2021-22. However at present, options are pricing in the smallest volatility premium in history, with IV between 24% and 52%, less than half of the long-term baseline.
📊

The IV term structure shows that over the last two weeks, volatility premiums are contracting. The December contract has seen implied volatility fall from 46% to 39% over the last two weeks alone. Options with an expiration out to June 2024 carry a volatility premium of just over 50%, which is historically low.

The Put/Call Ratio across both volume and open interest metrics are at, or near all-time lows, trading between 0.42 and 0.48. This suggests that there is a net bullish sentiment within in the market, and demand for call options continues to dominate.

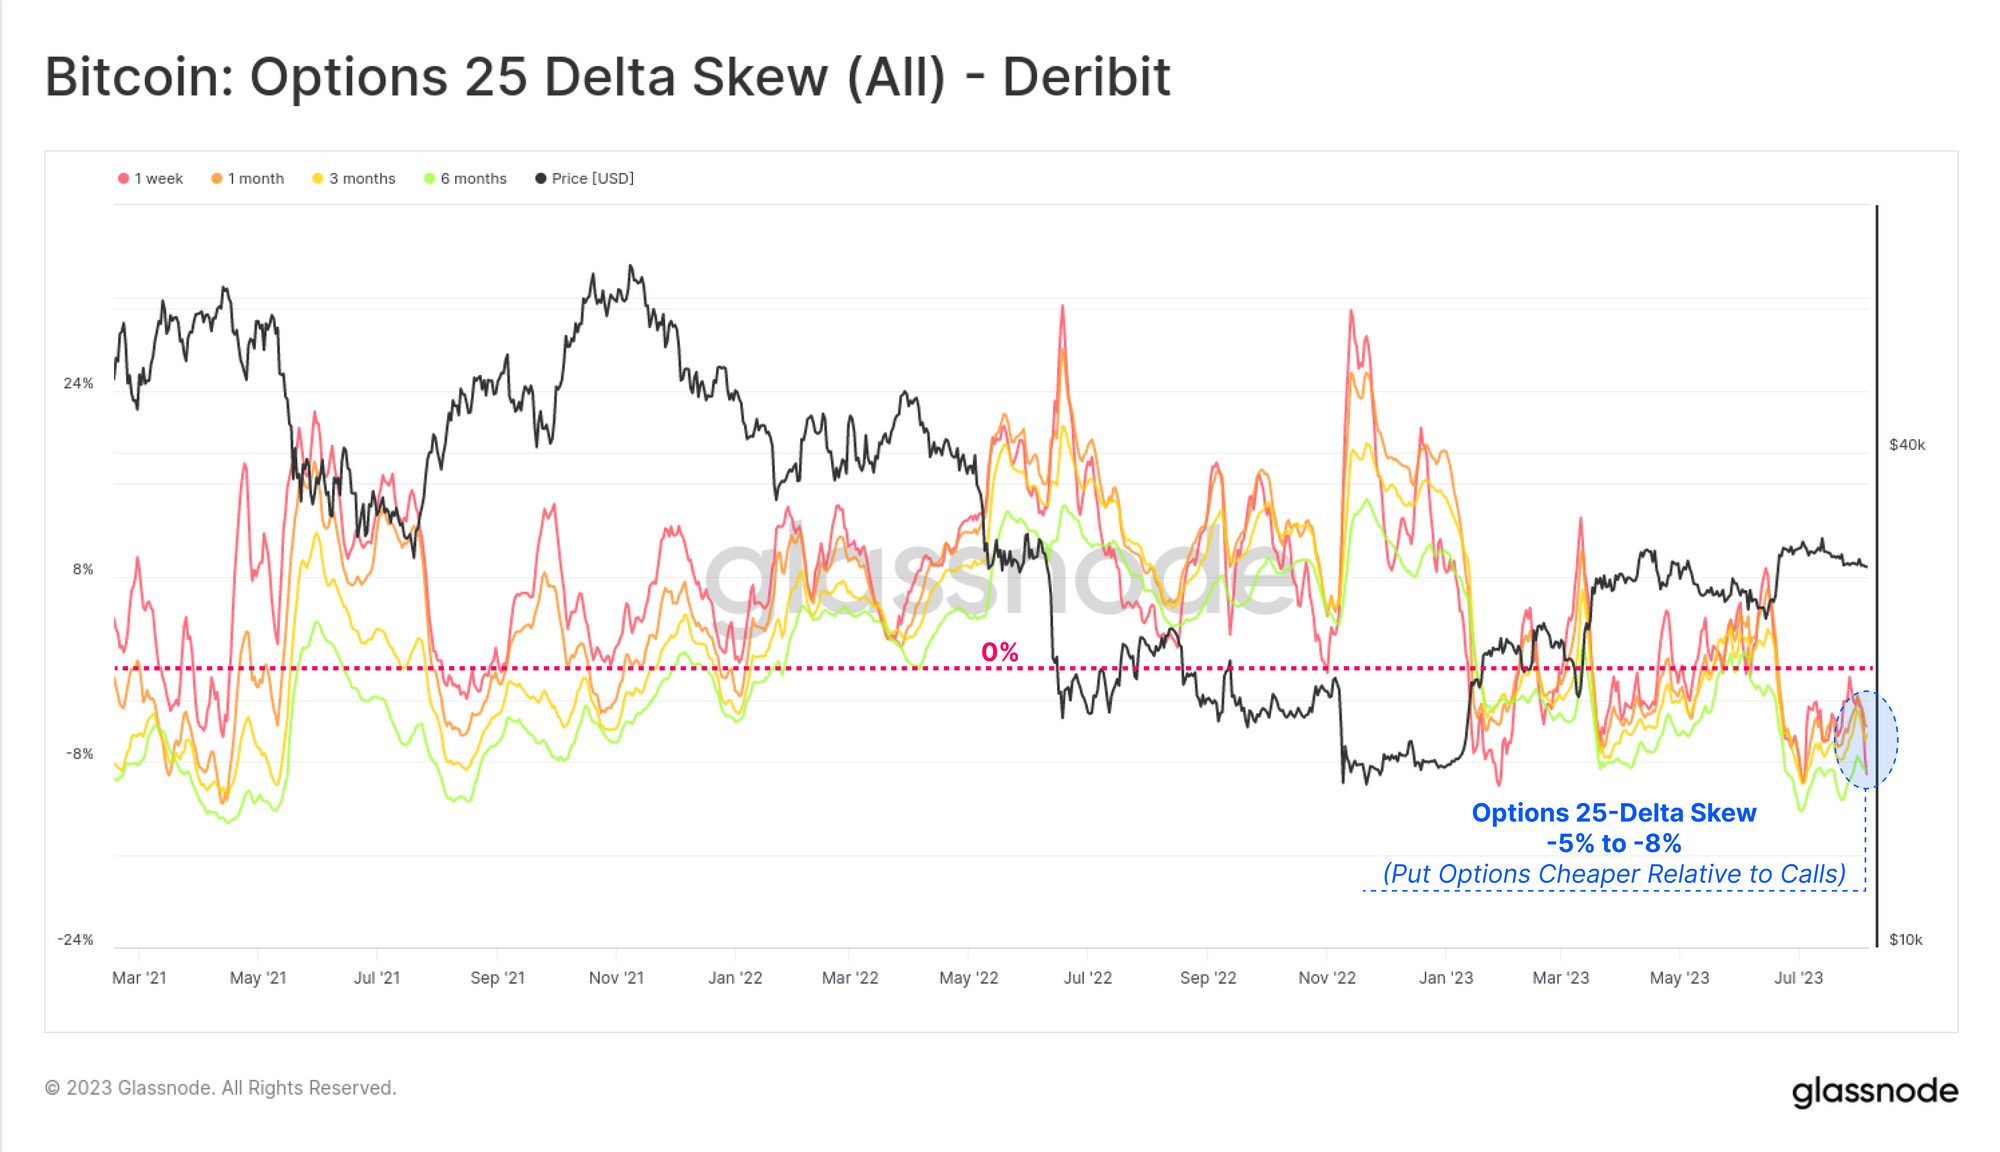
As a result, put options are increasingly cheap relative to calls, reflected by an all-time-low in the 25-delta skew metric. Overall, this indicates that options markets, which now rival futures markets in size, are pricing in historically low volatility on the road ahead.
However, given fewer than 5% of all trading days have seen a similar price range contraction, this suggests Bitcoin is either no longer infamously volatile…or volatility could be mispriced.
Summary and Conclusions
Few news headlines proclaim Bitcoin to be a price-stable and non-volatile asset, which makes monthly trade ranges of less than 10% stand out like a sore thumb. The market is arguably the least volatile it has ever been, calling into question whether heightened volatility is indeed ahead.
Futures cash-and-carry yields range between 5.3% and 8.1% which are marginally above the risk free rate of short-dated US T-bills. Options markets have priced in the lowest implied volatility premium in history, with put options in particular seeing the lightest demand.
Given the context of Bitcoin’s infamous volatility, is a new era of BTC price stability upon us, or is volatility mispriced?
Disclaimer: This report does not provide any investment advice. All data is provided for information and educational purposes only. No investment decision shall be based on the information provided here and you are solely responsible for your own investment decisions.

- SEO Powered Content & PR Distribution. Get Amplified Today.
- PlatoData.Network Vertical Generative Ai. Empower Yourself. Access Here.
- PlatoAiStream. Web3 Intelligence. Knowledge Amplified. Access Here.
- PlatoESG. Automotive / EVs, Carbon, CleanTech, Energy, Environment, Solar, Waste Management. Access Here.
- BlockOffsets. Modernizing Environmental Offset Ownership. Access Here.
- Source: https://insights.glassnode.com/the-week-onchain-week-32-2023/

