- Russell 2000’s week-to-date performance as of 9 November is the weakest among the US benchmark stock indices.
- The current bearish reaction that wiped out almost 50% of last week’s gains has occurred right below the former key range support and 50-day moving average.
- Watch the 1,787 key short-term resistance.
This is a follow-up analysis of our prior report, “Russell 2000 Technical: The weakest may get weaker again” published on 25 October 2023. Click here for a recap.
The bearish force has started to unleash its paws again against the small-cap Russell 2000 Index where its current week-to-date loss is at -4.17% as of 9 November 2023, the worst underperformer among the US benchmark stock indices; S&P 500 (-0.25%), Nasdaq 100 (+0.59%), and Dow Jones Industrial Average (-0.50%) over the same period.
Its latest key technical elements have turned bearish which indicates the start of another potential multi-week bearish impulsive sequence.
Bearish reaction from the former key range support
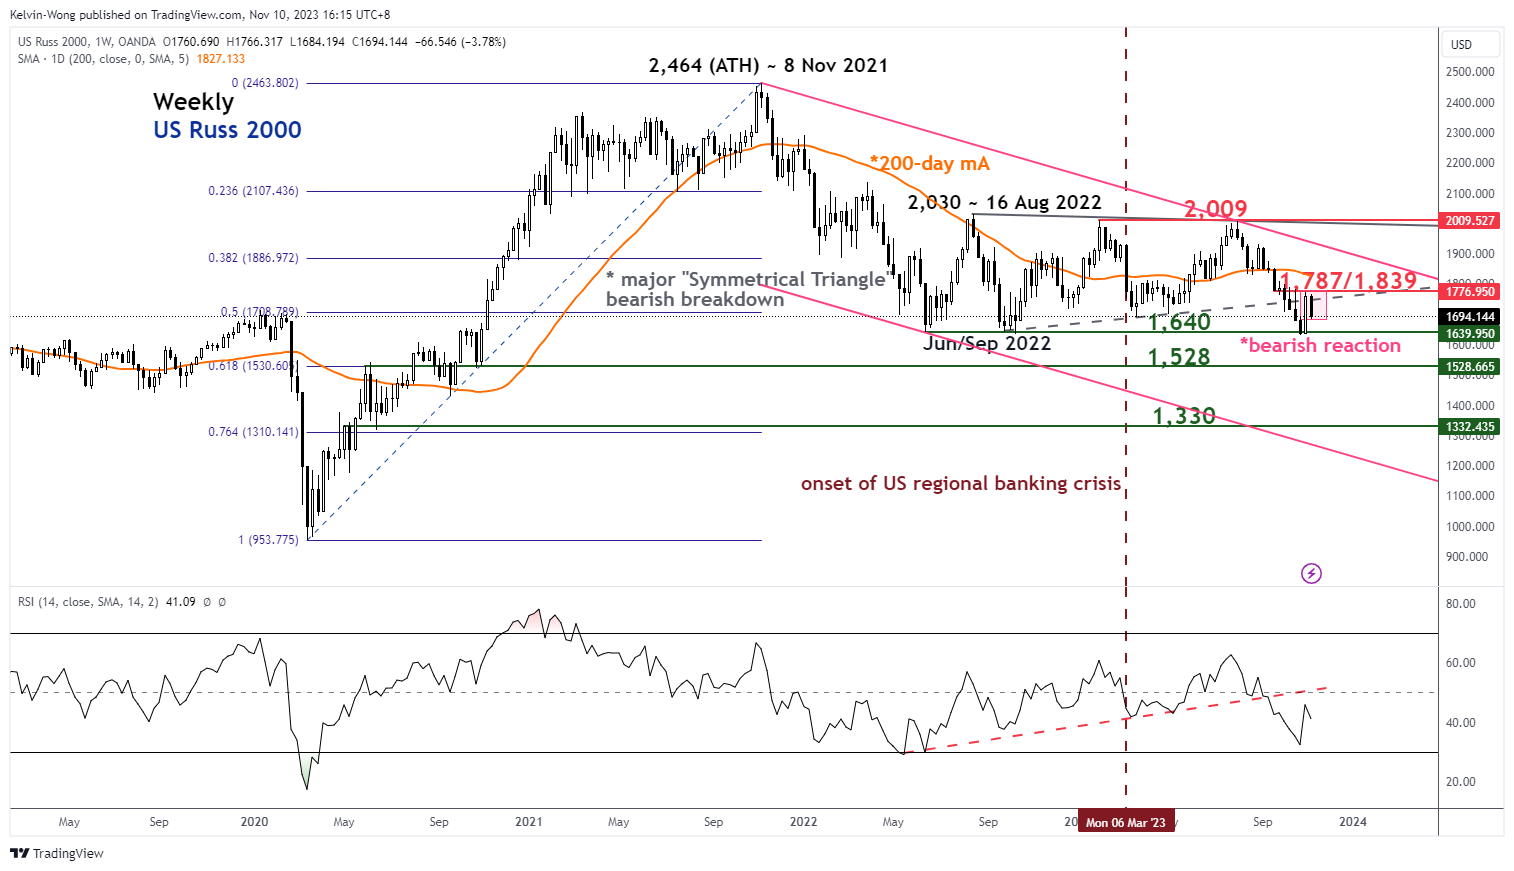
Fig 1: US Russ 2000 major trend as of 10 Nov 2023 (Source: TradingView, click to enlarge chart)
The current price actions of the US Russ 2000 Index (a proxy for the Russell 2000 futures) have almost wiped out 50% of last week’s gains induced by the dovish Fed Chair Powell’s ex-post FOMC press conference and the lacklustre US non-farm payrolls and ISM Services PMI data for October.
Interestingly, the current bout of bearish reaction has coincided with the former key “Symmetrical Triangle” range support from the June 2022 swing low now turns pull-back resistance at around 1,787.
Also, the weekly RSI momentum indicator has started to inch downward below the 50 level which indicates the potential revival of medium-term to major downside momentum.
Oscillating within a medium-term descending channel
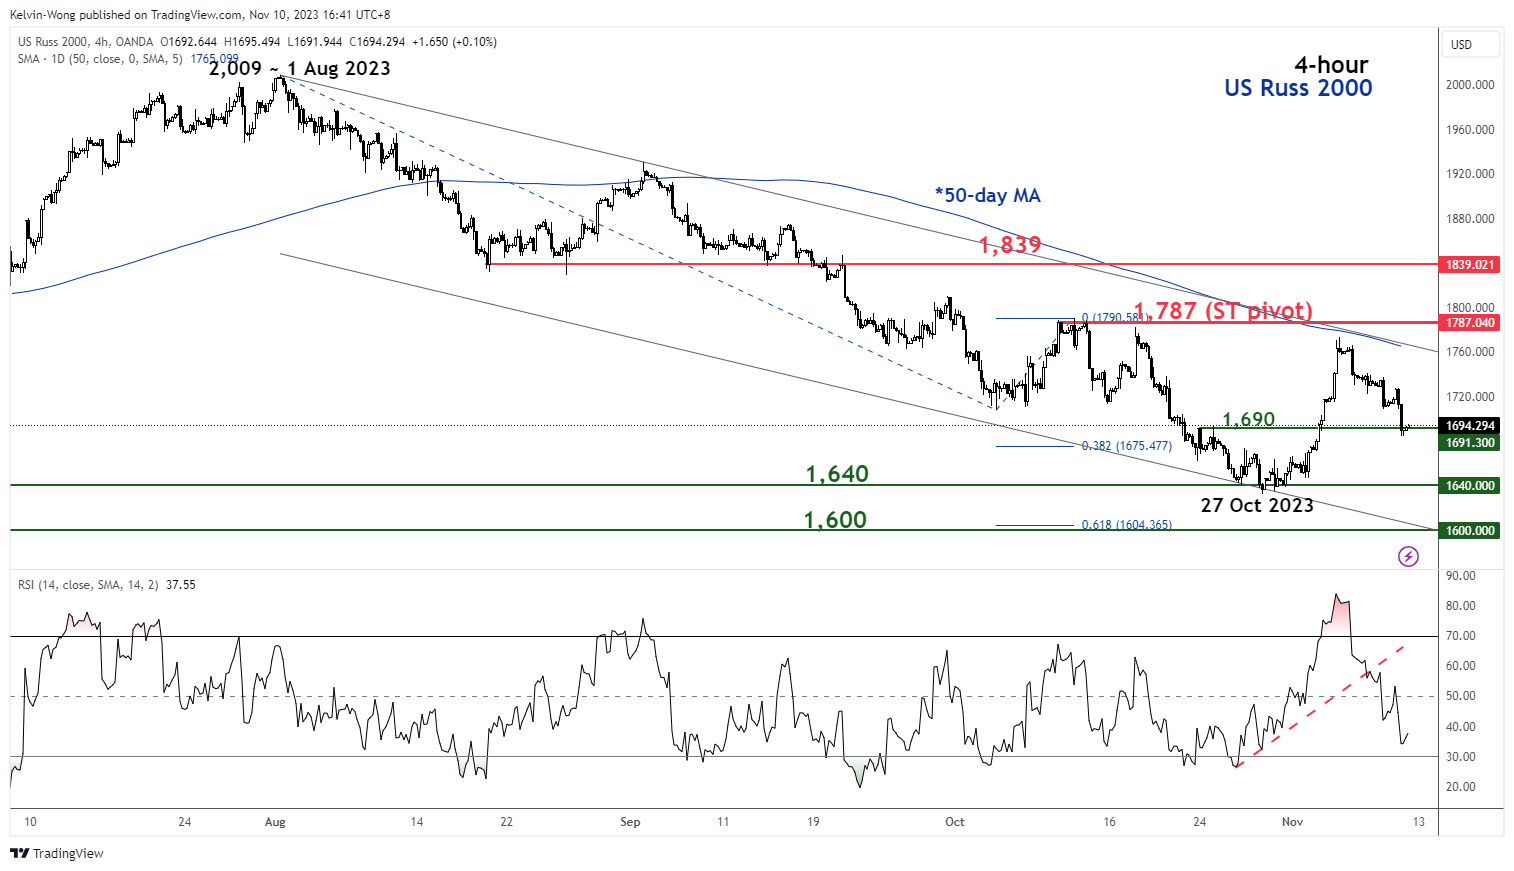
Fig 2: US Russ 2000 short-term trend as of 10 Nov 2023 (Source: TradingView, click to enlarge chart)
In the shorter time frame as seen on the 4-hour chart, the Index has continued to oscillate within a descending channel in place since 1 August 2023 where last week’s rally has been rejected right below the upper boundary of the descending channel and its downward sloping 50-day moving average.
All in all, these observations suggest that the odds are skewed towards the continuation of its short to medium-term downtrend phases of the Index rather than the start of a medium-term bullish reversal.
Watch the 1,787 key short-term pivotal resistance and a breakdown below its 1,690 near-term support may accelerate a further potential down move towards the next immediate supports at 1,640 and 1,600 (also the lower boundary of the descending channel & a Fibonacci extension level) in the first step.
On the other hand, a clearance above 1,787 negates the bearish tone for an extension of the corrective countertrend rebound to see the next intermediate resistance coming in at 1,839 (also the key 200-day moving average).
Content is for general information purposes only. It is not investment advice or a solution to buy or sell securities. Opinions are the authors; not necessarily that of OANDA Business Information & Services, Inc. or any of its affiliates, subsidiaries, officers or directors. If you would like to reproduce or redistribute any of the content found on MarketPulse, an award winning forex, commodities and global indices analysis and news site service produced by OANDA Business Information & Services, Inc., please access the RSS feed or contact us at [email protected]. Visit https://www.marketpulse.com/ to find out more about the beat of the global markets. © 2023 OANDA Business Information & Services Inc.
Latest posts by Kelvin Wong (see all)
- SEO Powered Content & PR Distribution. Get Amplified Today.
- PlatoData.Network Vertical Generative Ai. Empower Yourself. Access Here.
- PlatoAiStream. Web3 Intelligence. Knowledge Amplified. Access Here.
- PlatoESG. Carbon, CleanTech, Energy, Environment, Solar, Waste Management. Access Here.
- PlatoHealth. Biotech and Clinical Trials Intelligence. Access Here.
- Source: https://www.marketpulse.com/indices/us-russell-2000-technical-bearish-reaction-at-a-key-inflection-point/kwong

