Maker (MKR), Solana (SOL), and BONK top the list of top altcoins to buy for 2024 as Bitcoin bleeds amid increased volatility.
Wednesday’s crypto market sell-off sent Bitcoin and most altcoins tumbling, with losses exceeding double digits. Bitcoin price plunged to $40,000 after brushing shoulders with $46,000, while Ethereum, after reaching $2,400, fell back to test support at $2,100. Top altcoins like Maker (MKR), Solana (SOL), and Bonk (BONK) weren’t spared from the volatility, their uptrends abruptly halted, potentially presenting buying opportunities for investors looking to capitalize on the dip.
advertisement
<!–
adClient.showBannerAd({
adUnitId: “856eec25-5bac-4623-9cc6-5827ff47c238”, containerId: “market-banner-ad-mobile”
});
–>
What’s Behind Crypto Price Volatility?
Uncertainty regarding the approval of spot exchange-traded funds (ETFs) in the US is leading to a spike in volatility. By December, experts and investors agreed that the Securities and Exchange Commission (SEC) was ready to node to spot Bitcoin ETFs in January.
The rising optimism buoyed the market with tokens like SOL and MKR breaking out significantly. ETFs are expected to be new conduits for channeling investment into the crypto market, with operators likely to increase demand for BTC thus creating the right environment for a bull run.
However, a new report released by research firm Matrixport poked holes in the expectations, stating that the SEC is likely to reject all the applications. According to the report, despite the recent proposals’ refiling and meetings with SEC officials, applicants seem to have missed out on one requirement which may take them until Q2 to fulfill.
Despite the uncertainty, this article will delve into three top altcoins to buy for 2024.
Read Also: Crypto Price Prediction For January 3: SOL, ICP, MKR
Solana Price Pullback Under $100, A Buy The Dip Opportunity?
Solana emerged as the best performer in Q4 2023, where it consistently climbed to new yearly highs. Its break above $100 in December bolstered the uptrend as FOMO spread among investors to $125.
However, due to the extremely overbought conditions, SOL price embarked on a trend correction, pushed down by profit-taking initiatives.
The sell-off in the market on Wednesday dragged Solana price lower below $100 with the candle wick stretching to $85.
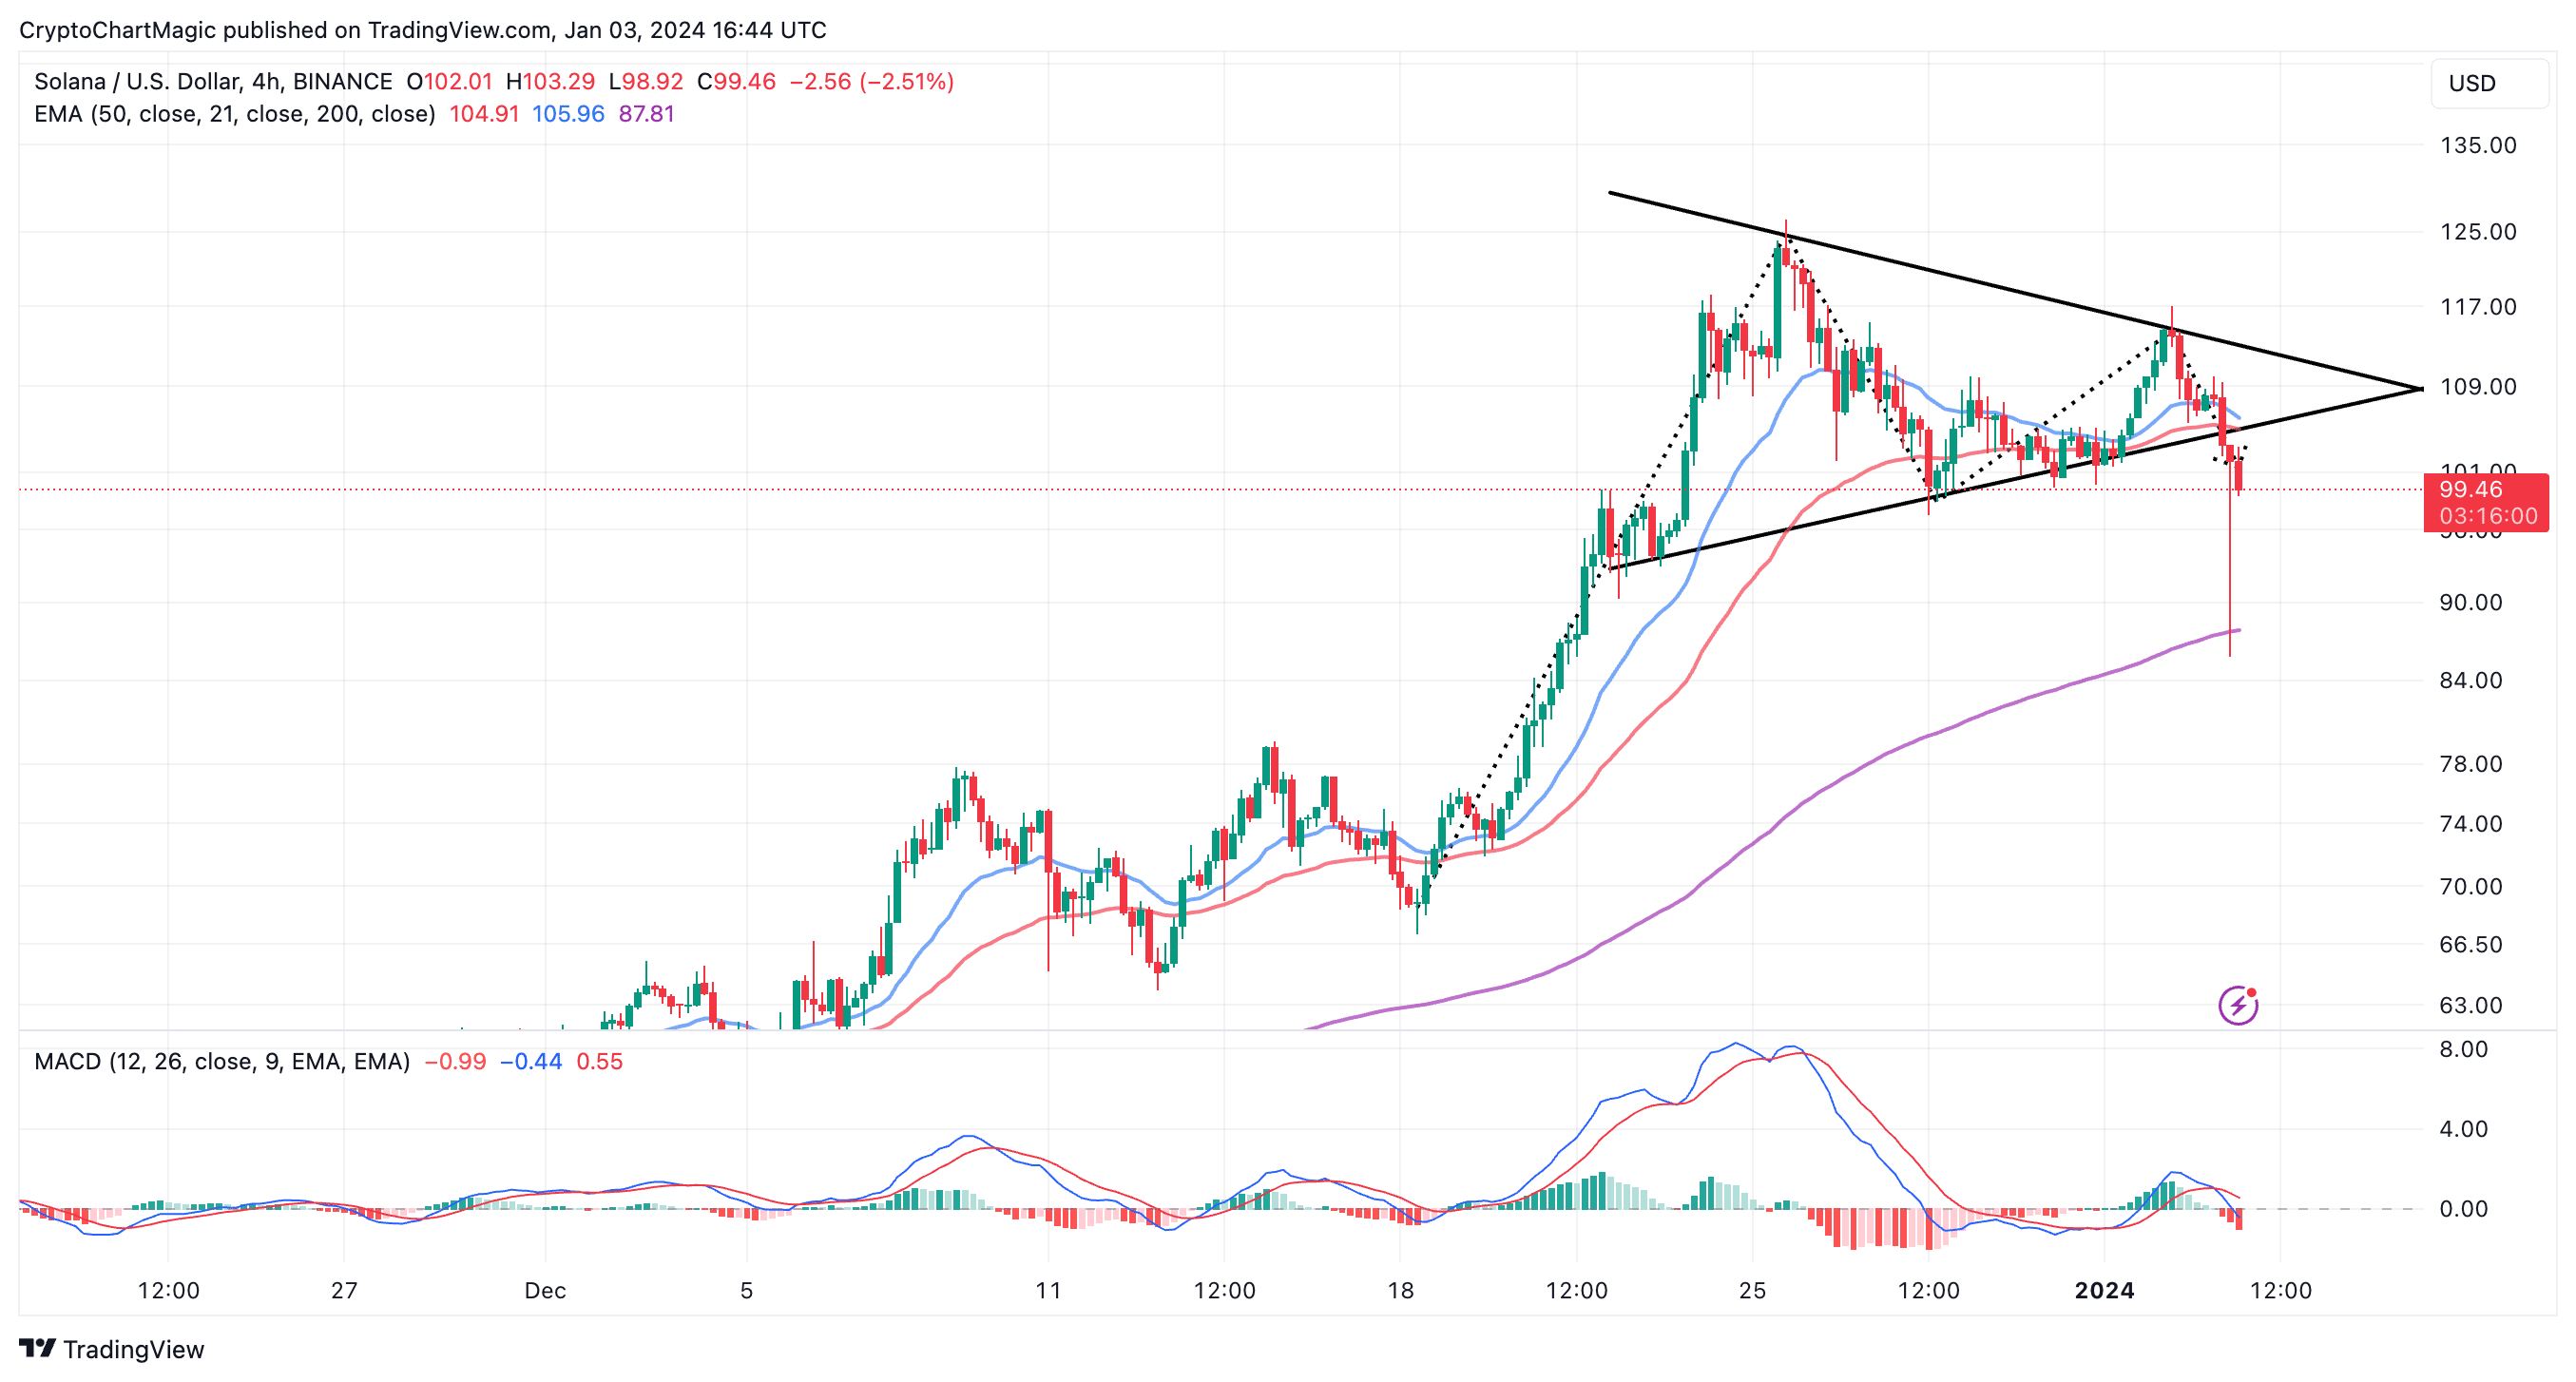
Although SOL is back to trading at $100, as sell signal from the Moving Average Convergence Divergence (MACD) indicator implies that the downtrend is far from over.
This means that if support at $100 fails to hold, Solana price could drop to sweep through liquidity at the 200 Exponential Moving Average (EMA) (in purple) at $88.
If Solana steadies above $100 it is likely to attract investors amid calls for a sharp climb to $125 and subsequently toward the next major breakout to $200.
Maker Price Prediction As Triangle Breakout Sends MKR To $2,000
After a bullish fractal played out, Maker price broke out of an elaborate ascending triangle with a 55% target to $2,423. Now that MKR has already started the breakout, it may be essential to look out for higher support, preferably above $1,830 before seeking exposure with long orders.
Caution is advised particularly due to the uncertainty of the ETF approval, which might trigger a sell-off if rejected.
On the bright side, greenlighting the ETF could collectively boost the crypto market, including top altcoins like Maker.
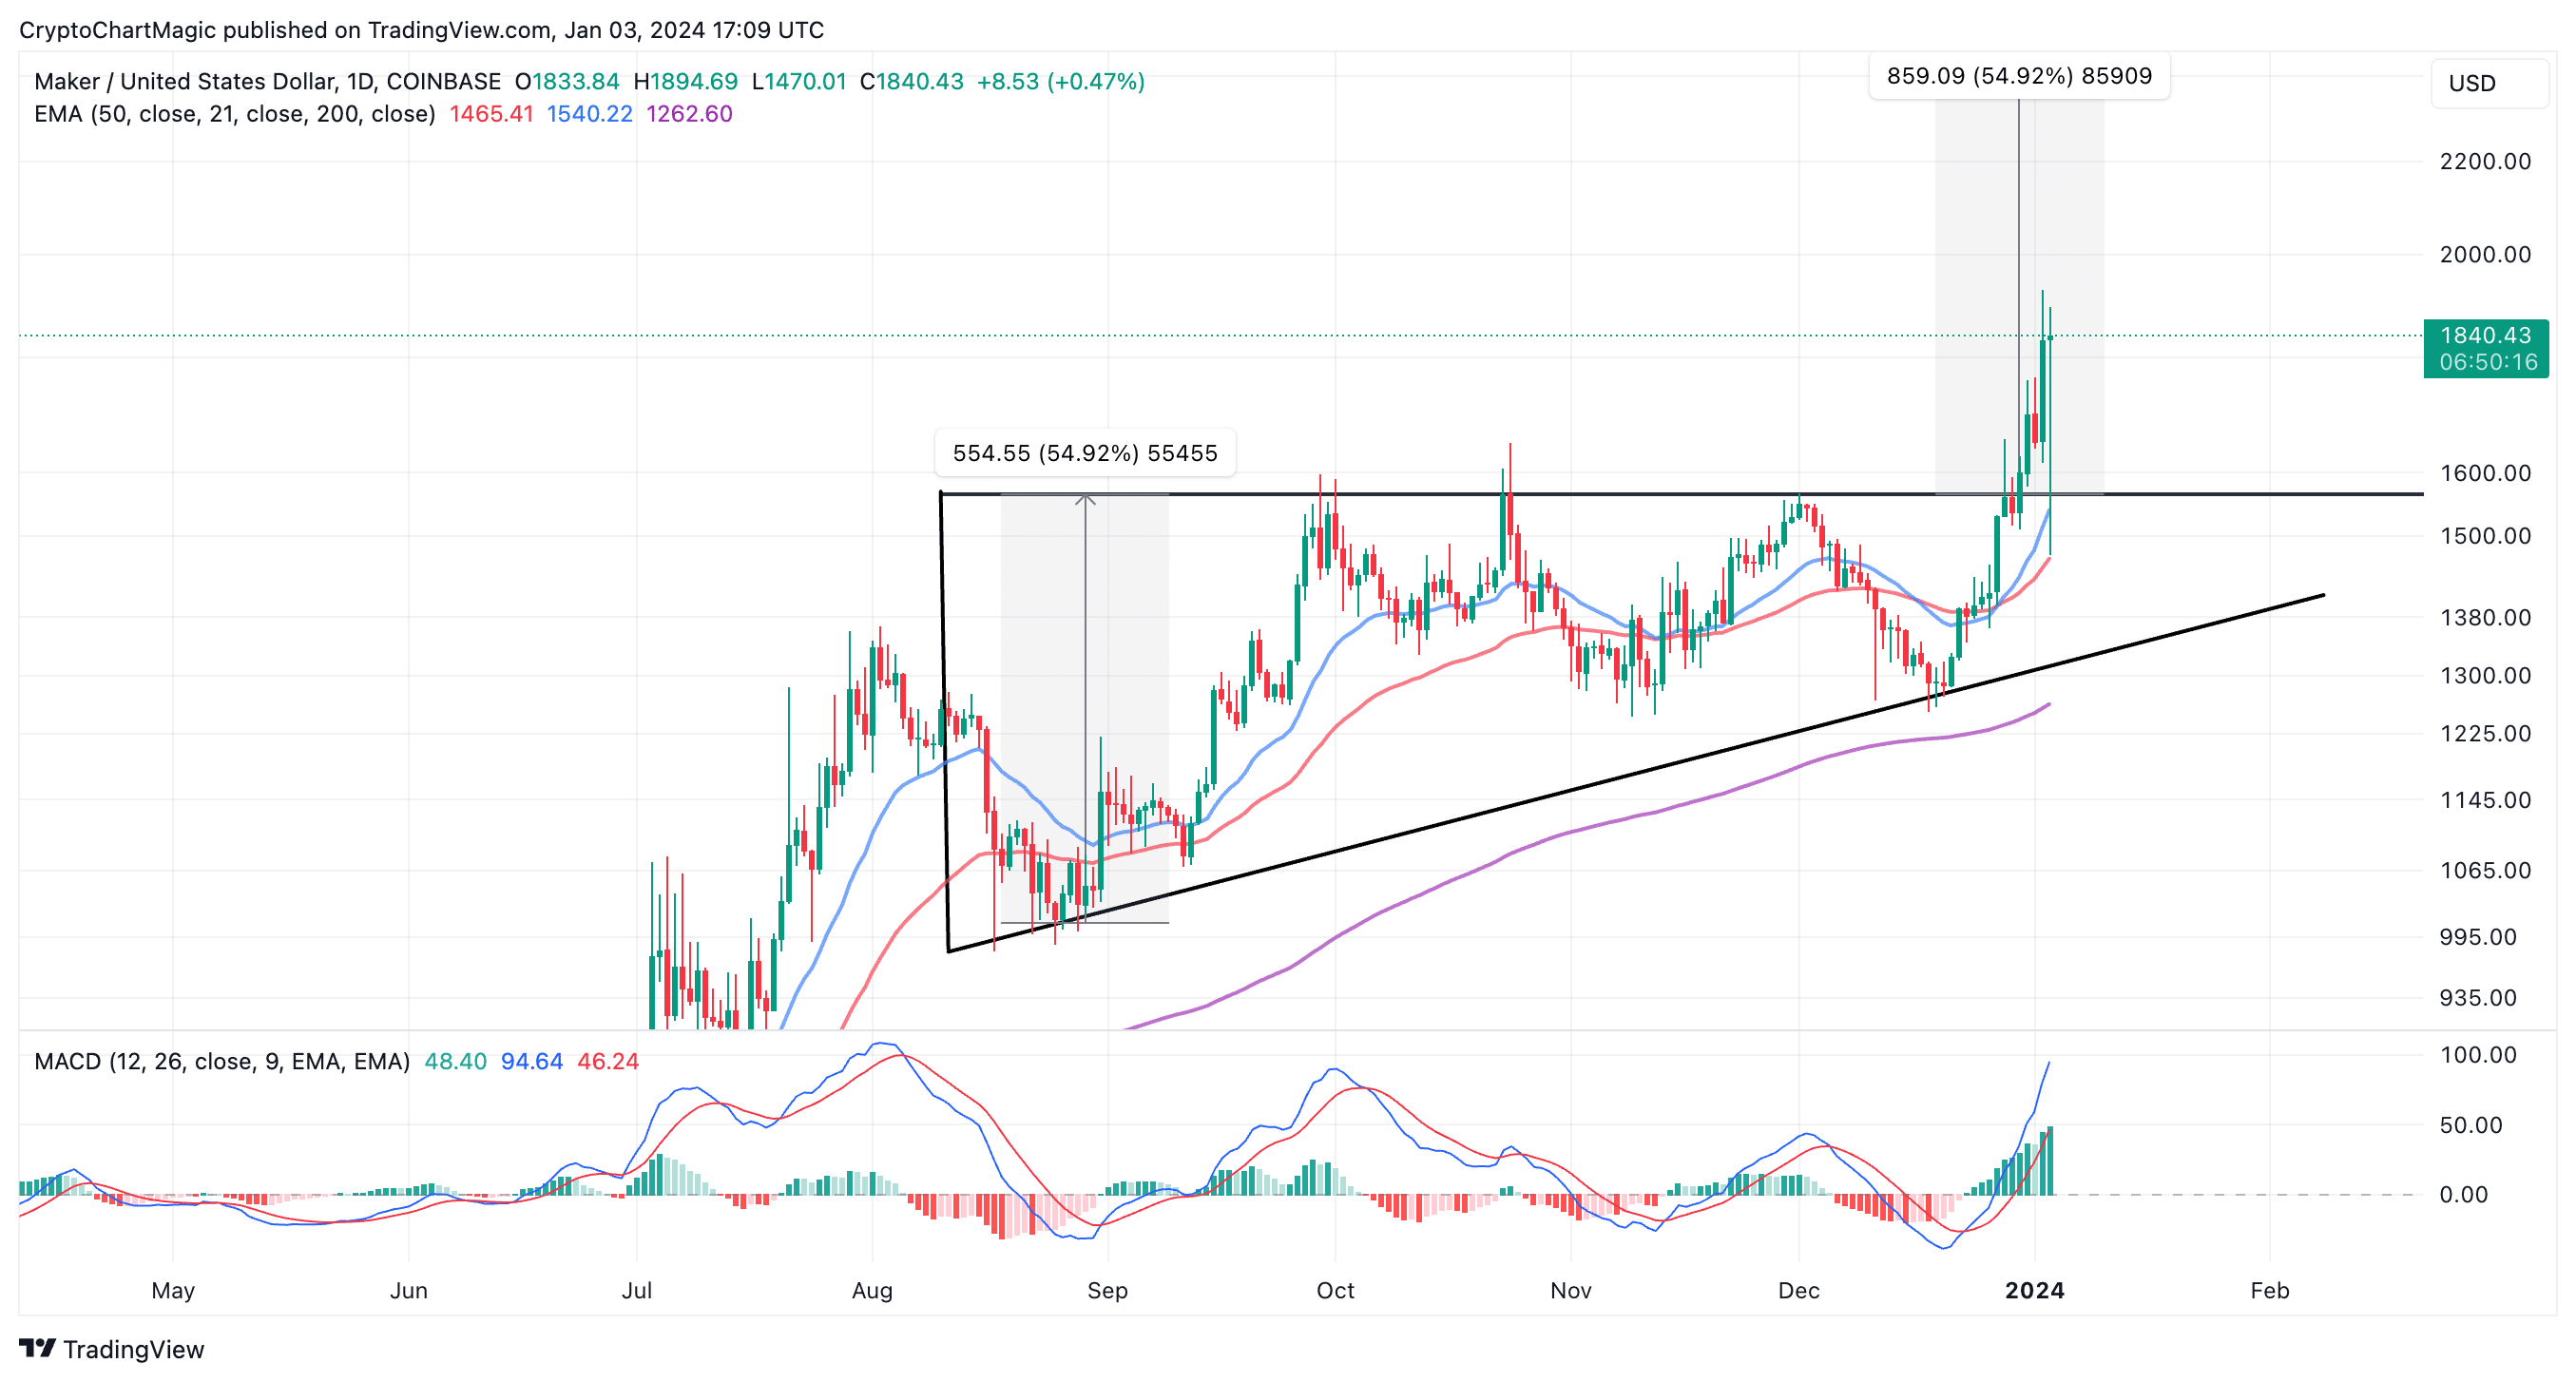
Due to the buy signal from the MACD indicator, bulls are likely to hold the reins while MKR climbs to the triangle breakout target at $2,423. A break above $2,000 would signal the uptrend is sturdy and ready to continue.
A trend reversal will follow the blue MACD line’s drop below the red signal line. In such a scenario, it might be prudent to lock in the gains and buy at a lower price point, for instance, the previous triangle resistance at $1,564 and $1,450.
Bonk Price Prediction As Bulls Search For Support
Bonk continues to dump several weeks after the pump in November fuelled by the listings on Binance and Coinbase. The meme coin built on the Solana blockchain, remarkably exploded to $0.000035 in early December buoyed by exposure to a wide audience.
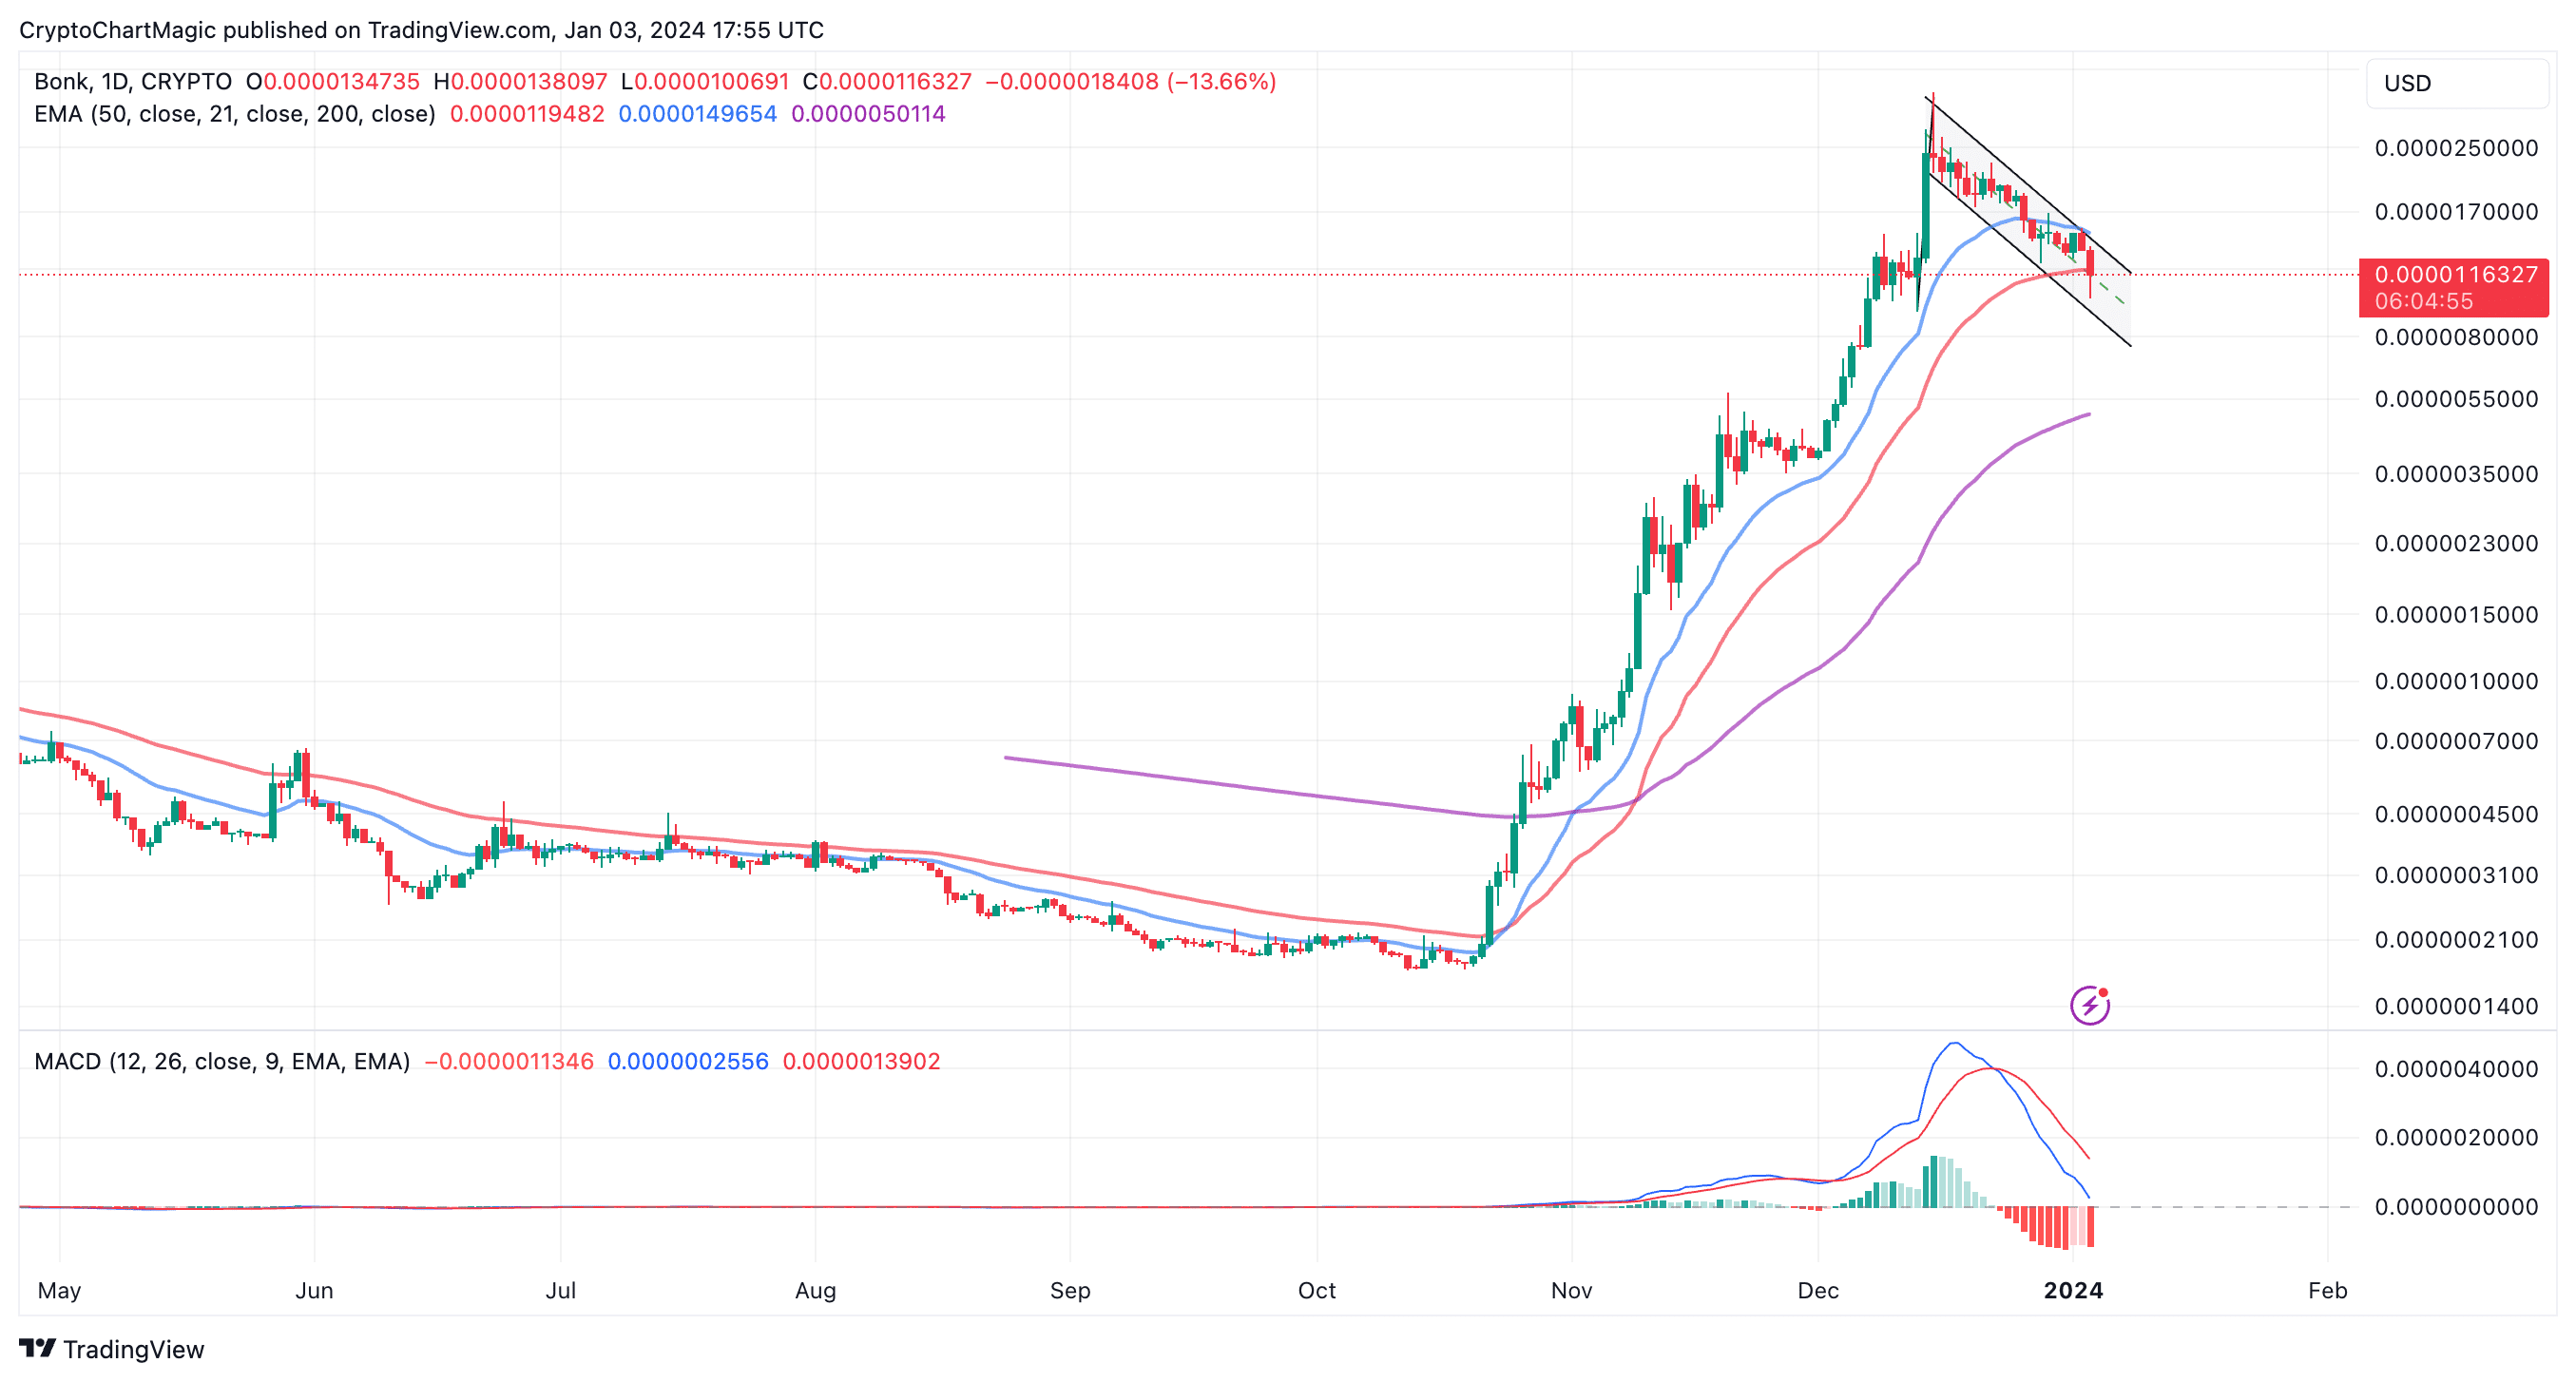
Following the commendable rally, some investors cash out for profit, leading to the ongoing trend correction within the confines of a descending channel.
The MACD indicator affirms the bearish outlook with a vivid sell signal. As the MACD drops toward the neutral area, more traders are encouraged to sell, thus adding pressure to the headwinds.
The 50-day Exponential Moving Average (EMA) (in red) could serve as a prime entry position for investors wishing to dollar-cost average (DCA) into Bonk if it holds as support at $0.00001194.
Bleeding will continue if this support fails to hold, thus it would open door bears can explore and push Bonk below $0.00001. Nonetheless, finding a good entry point could help investors capitalize on Bonk price discovery to $0.0001.
advertisement
Related Articles
- SEO Powered Content & PR Distribution. Get Amplified Today.
- PlatoData.Network Vertical Generative Ai. Empower Yourself. Access Here.
- PlatoAiStream. Web3 Intelligence. Knowledge Amplified. Access Here.
- PlatoESG. Carbon, CleanTech, Energy, Environment, Solar, Waste Management. Access Here.
- PlatoHealth. Biotech and Clinical Trials Intelligence. Access Here.
- Source: https://coingape.com/markets/top-altcoins-to-buy-today-january-3-mkr-sol-bonk/

