The Realized Cap is one of the most important and foundational tools in the on-chain analysis discipline. It is computed from the Pricestamps assigned to each coin at the time when it last transacted, which is a property uniquely associated with public and transparent blockchains. This forms the backbone for several analytical frameworks which enable unparalleled assessment of market behaviour, investor sentiment, and capital in/outflows from digital assets.
Metrics that are derived from, or components of the Realized Cap include Unrealized, and Realized profit and loss metrics. These tools are particularly suitable for market analysis and trade strategy development as they describe the motivating financial incentives (fear and greed) which drive investor decisions.
In this article, we will explore the fundamentals of the Realized Cap, as well as outline several methodologies and frameworks for considering Profit/Loss metrics for analysis. The aim is to help contextualise how on-chain data which leverages Pricestamping provides a unique lens into investor psychology and market dynamics.
Along the way, we will occasionally leave a few of our favourite market quotes which often encapsulate the investor psychology being described within on-chain data.
“An investment in knowledge pays the best interest.”
– Benjamin Franklin
Preamble: The Value in Realized Value
Pricestamping coins is an elegant solution which enables the modelling of market performance in ways which often cannot be easily replicated in traditional finance:
- Estimate the cost basis of investor cohorts enabling the assessment of support and resistance, as well price levels where investor sentiment may shift. This can be amplified by filtering data by cohorts such as Long/Short-Term Holders to better isolate the investor cross sections that are driving market conditions.
- Assess Unrealized Value (the incentive to spend) to model the value which is ‘saved’ within the asset. This forms a measure of aggregate capital in/outflows. From this we can track both the coin volume and the unrealized profit/loss held within the supply.
- Track Realized Value (the value locked in by spending) to model the actual profit or loss taking behaviour by various cohorts, describing the economic value which is exiting and entering the asset.
- Discount lost and long dormant supply which carry a relatively cheap ‘realized value’ (e.g. early miner and Satoshi coins have a realized value of $0). This also accounts for relative liquidity where active supply is regularly revalued near the current spot price.
Re-introducing the Realized Cap
The Realized Cap is the cumulative sum of all Realized Profits minus Realized Losses. In other words, it is the aggregate value that has flowed into Bitcoin on-chain, minus capital flowing out via losses. It tends to move in two distinct regimes:
- Steep and sharp repricing higher during bull markets as investors who accumulate cheap coins in the bear market distribute coins to new buyers at elevated and increasingly expensive prices.
- Sideways plateaus and declines in bear markets as expensive coins are revalued lower until complete investor capitulation takes place. This has historically accompanied a lengthy market consolidation where coins transact and gradually change hands, moving back towards higher conviction holders.
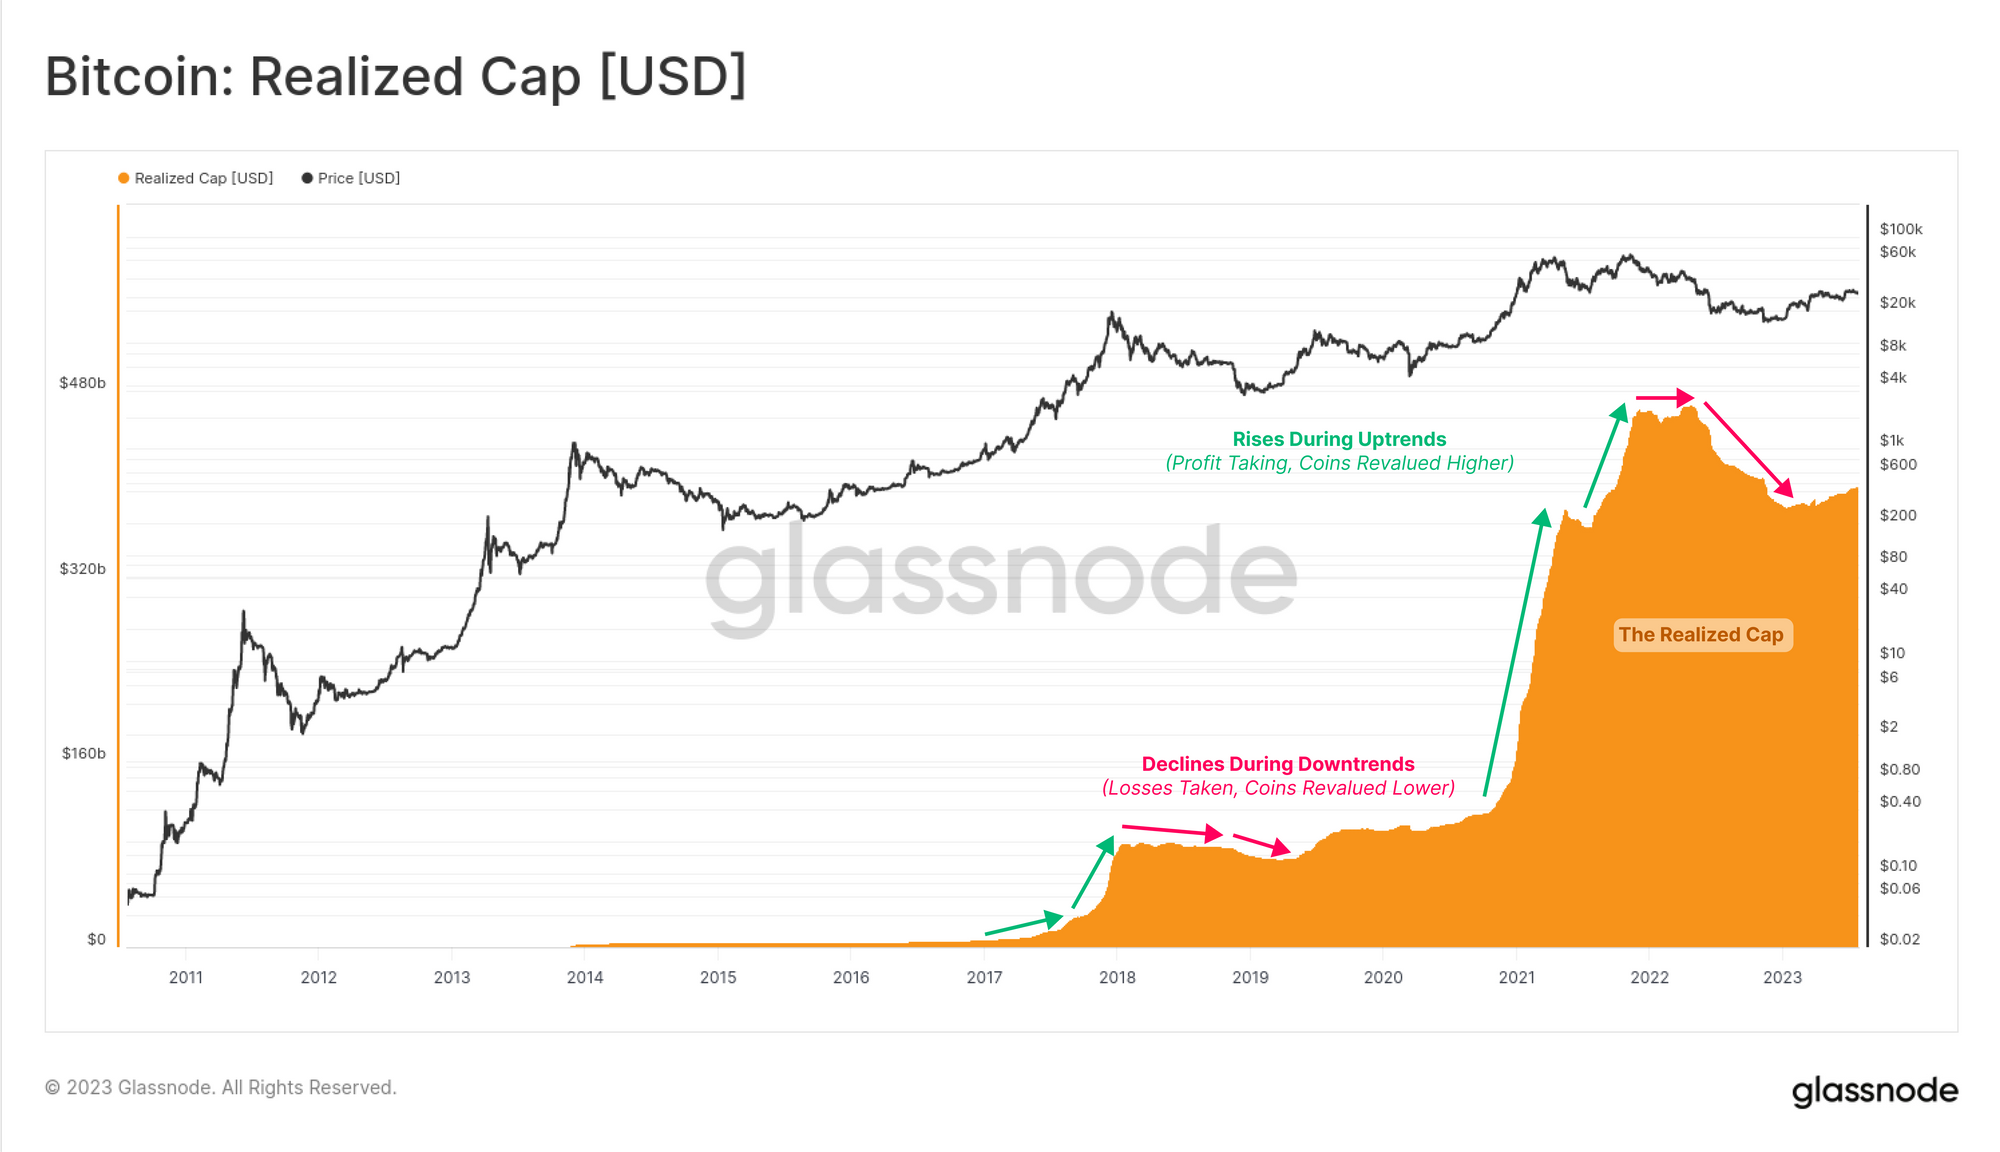
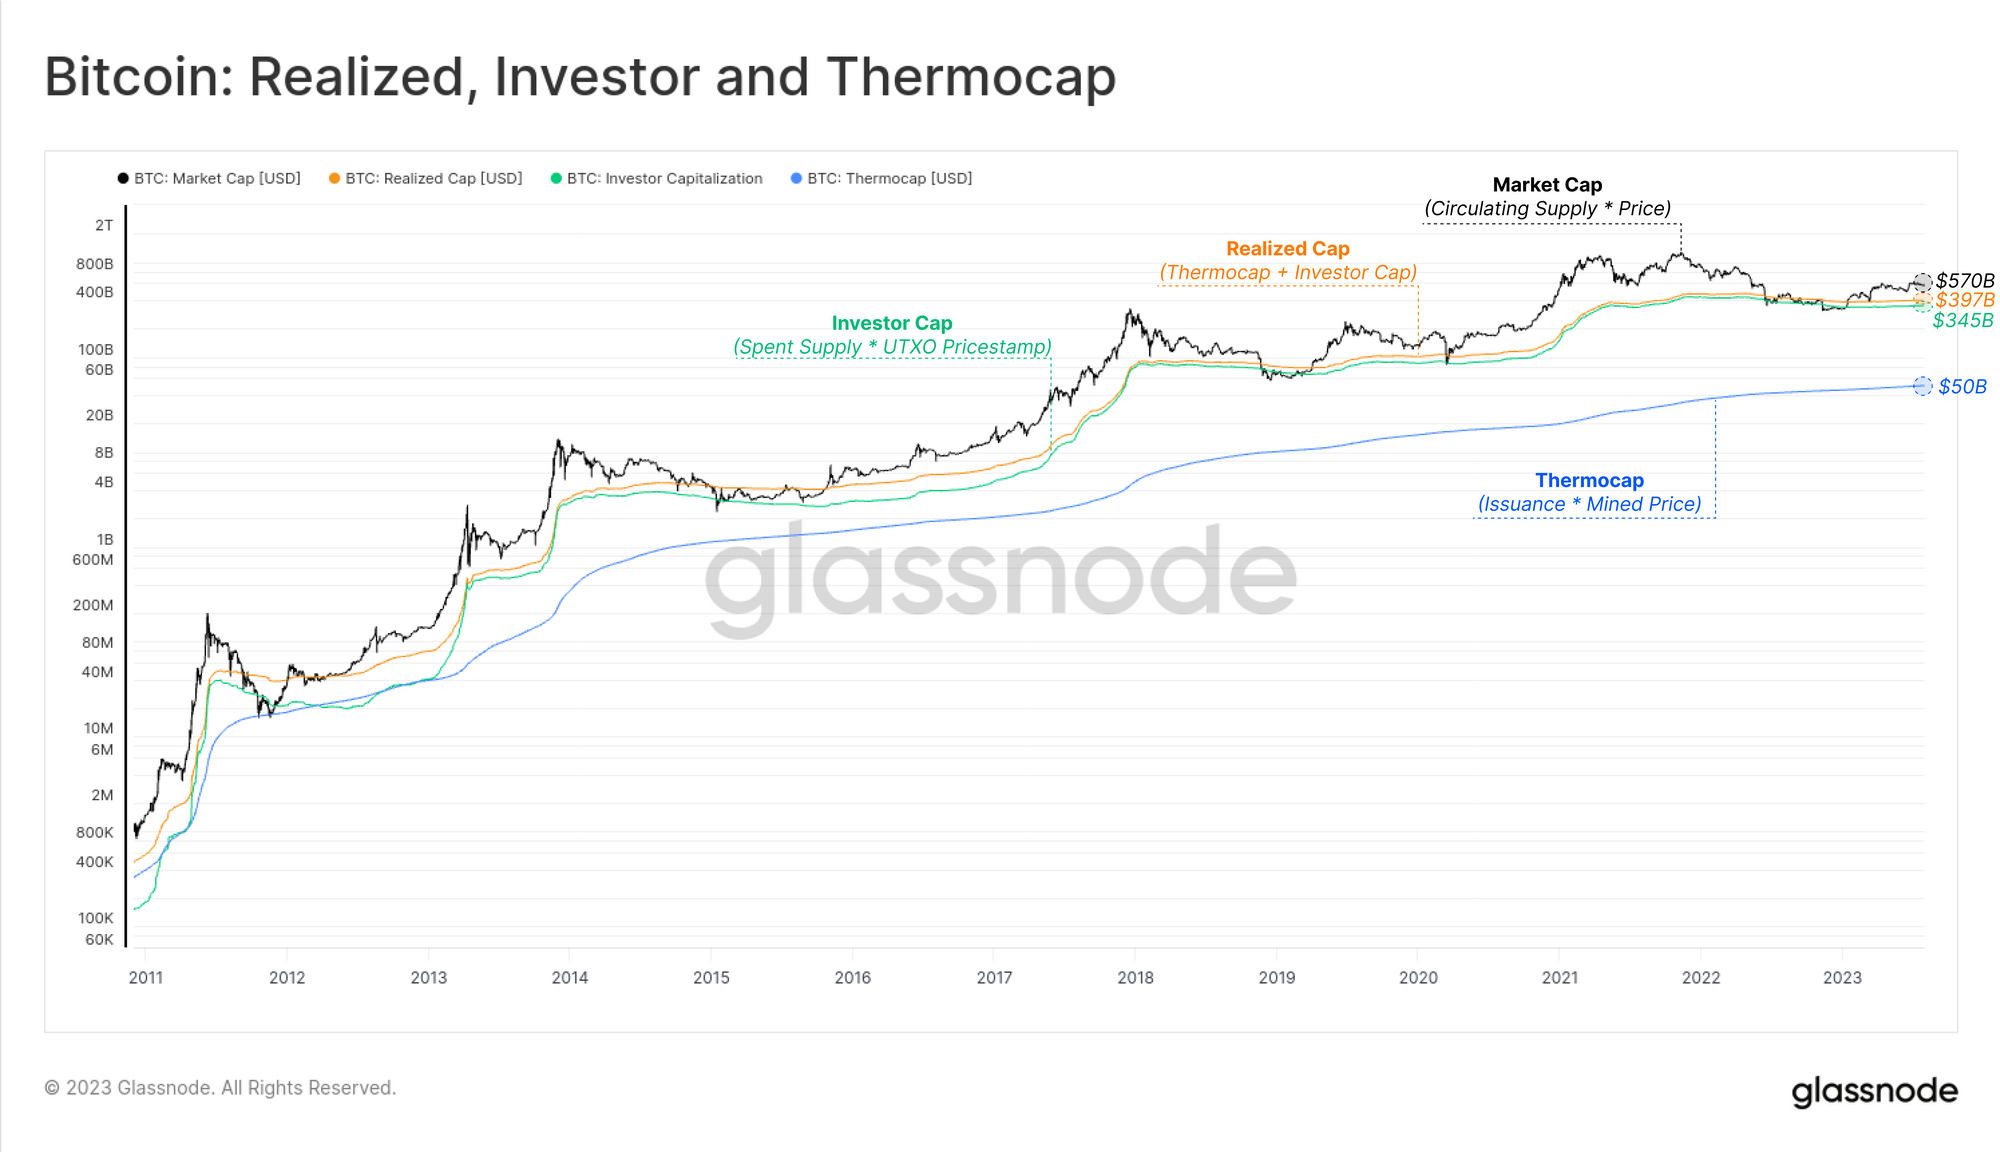
There are three primary components which make up the Realized Cap:
- Newly minted supply which is pricestamped as soon as the new block is found. In aggregate this is referred to as the Thermocap.
- Realized profits as investors spend and revalue cheap coins to expensive prices in secondary markets.
- Realized losses which subtract value from the Realzied Cap as expensive coins are revalued lower.

We can view these valuation frameworks on the same axis as the Bitcoin Market Cap for a sense of scale:
- Market Cap ($580B) which values the circulating supply at the spot price.
- Realized Cap ($397B) which is the aggregate value ‘saved’ or ‘stored’ in BTC.
- Investor Cap ($345B) being is the net value (profit minus loss) realized across all secondary market transactions.
- Thermocap ($50B) which is the primary production market of BTC by miners.
As we can see in both charts above and below, the Thermocap (+$50B) is a relatively minor contributor to the Realized Cap, and is dwarfed by in scale both the Realized Profit (+$861B) and Realized Loss (-$516B) components. This observation, helps frame up a case for why the Realized Profit/Loss occurring in secondary markets is of primary interest for on-chain analysts.
The Declining Role of Miners
In modern times, the Thermocap accounts for just 8.7% of the total value stored within the Realized Cap. The chart below shows that up until the second halving (in 2016), issuance (blue) accounted for around 20% to 40% of the value entering/exiting Bitcoin on a daily basis.
Since then, issuance accounts for at most 10% of the daily realized value, and is more often closer to 1-2%. The influence of miners and new issuance can therefore be argued to be most meaningful during periods of exceptionally light liquidity and minimal trade volume. This is often pro-cyclical, with miner distribution pressures reaching a relative maxima during late stage bear markets when investor attention/demand is at its weakest.

Fear and Greed Drive Decisions
From this, we can also deduce that Realized Profits and Losses are dominant factors which drive capital flows in and out of Bitcoin. In particular, we can see that:
- Realized Profits dominate during macro uptrends, and frequently peak around local and global market highs. This describes the mechanic of profit taking which eventually over-saturates incoming demand (via a correction, or macro scale trend shifts).
- Realized Losses tend to dominate during macro bearish trends, and have historically experienced two notable ‘capitulation spikes’; first at the start of a bear market (the shot across the bow), and then again as the market approaches maximum negative sentiment and eventual exhaustion.
At the end of the day, profit and loss are the primal drivers of investor decisions. By assessing the market through the lens of realized profit and loss, analysts can obtain an information dense perspective of investor sentiment and positioning, as coins are revalued and change hands.
“Be fearful when others are greedy.
Be greedy when others are fearful.”
— Warren Buffet

If we subtract the USD denominated realized losses from profits, we can observe the Net Realized value which is entering or exiting Bitcoin each day. From this, we can clearly see the dominance of the profit and loss components during bullish and bearish market regimes, respectively.
We can also see how the magnitude of profit and loss in prior cycles disappear in linear scale. As such, analysis of these metrics often requires some form of normalization, with BTC denomination, 2-4yr rolling Z-scores, or in a ratio with a 1-2y moving average being suitable approaches in our experience.
Note: Net Realized Profit/Loss is both the first derivative of the Realized Cap, and also the result of the aggregate realized profit minus loss each day.

The Mechanics of Realized Profit/Loss
The next chart presents the total Realized Profit on a USD basis, which shows how the volume of profit locked in by investors experiences a parabolic expansion during bull markets. This is a function of the coins which were diligently accumulated by the price insensitive HODLer cohort during the prior bear cycle being distributed into market strength.
This supply was often acquired at cheap prices, and has matured for months to years in cold storage. As such, Realized Profit is often well paired with metrics such as Coindays Destroyed, and/or declines in Long-Term Holder Supply for a more holistic view of this behaviour.
As we covered in a prior report, this HODLer distribution phase has historically accelerated upon a successful break of the market all-time-high leading to an increase in realized profit magnitudes, and a sharp repricing of the Realized Cap higher.
‘It is a curious fact that although all booms are alike,
all are different.’ — Edwin Lefeyre

If we compare Realized Profit [BTC] to its all-time-mean, we can see that +1 standard deviation moves tend to accompany the irrational exuberance of a bull market peaks. Ironically, the periods of maximal profit taking are in fact the periods of increasing risk of a market contraction / drawdown just over the horizon.

Naturally, when the market is in price discovery, the magnitude of loss held within the coin supply tends to be limited, constrained only to investors who buy local tope spending during corrections and consolidations. However, what goes up must inevitably come down.
A major acceleration in Realized Losses tends to accompany the ‘shot across the bow‘ sell-off which often follows a blow-off top. This tends to plant the first seeds of bear market sentiment. Global market peaks are generally a symptom of an exhausted inflow of new demand, combined with large swathes of investors being caught off-sides holding coins acquired at expensive prices.
Patient HODLers gradually transfer their long dormant coins to newer and less experienced investors, often near the market top. Therefore, analysis of the relationship between price and the realized price (on-chain cost basis) of various investor cohorts can be instructive (e.g. via variants of the MVRV Ratio). The price distribution of the supply (URPD) can also help identify these ‘top heavy’ markets.
The Realized Cap often plateaus or gradually declines throughout bear markets. The chart below shows how elevated realized loss levels tend to be sustained over longer periods of time, as the market digests and consolidates the bear market. As the attention of speculators and new investors dwindles, the higher conviction and price insensitive HODLer cohort begin to diligently work towards establishing a market floor.
In bear markets, stocks return to their rightful owners.
— J.P Morgan

To date, Bitcoin bear markets have often found their ultimate floor in a somewhat spectacular fashion, with violent capitulation events and extraordinary Realized Losses. Such events are well captured by identifying periods when realized losses [BTC] exceed a 1 standard deviation move.

Unrealized profit/loss metrics are a valuable supplement to the realized variants explored above as they describe the financial incentive for investors to spend. Generally speaking, the more profit or loss an investor holds, the more likely they are to take chips off the table, or capitulate, respectively.
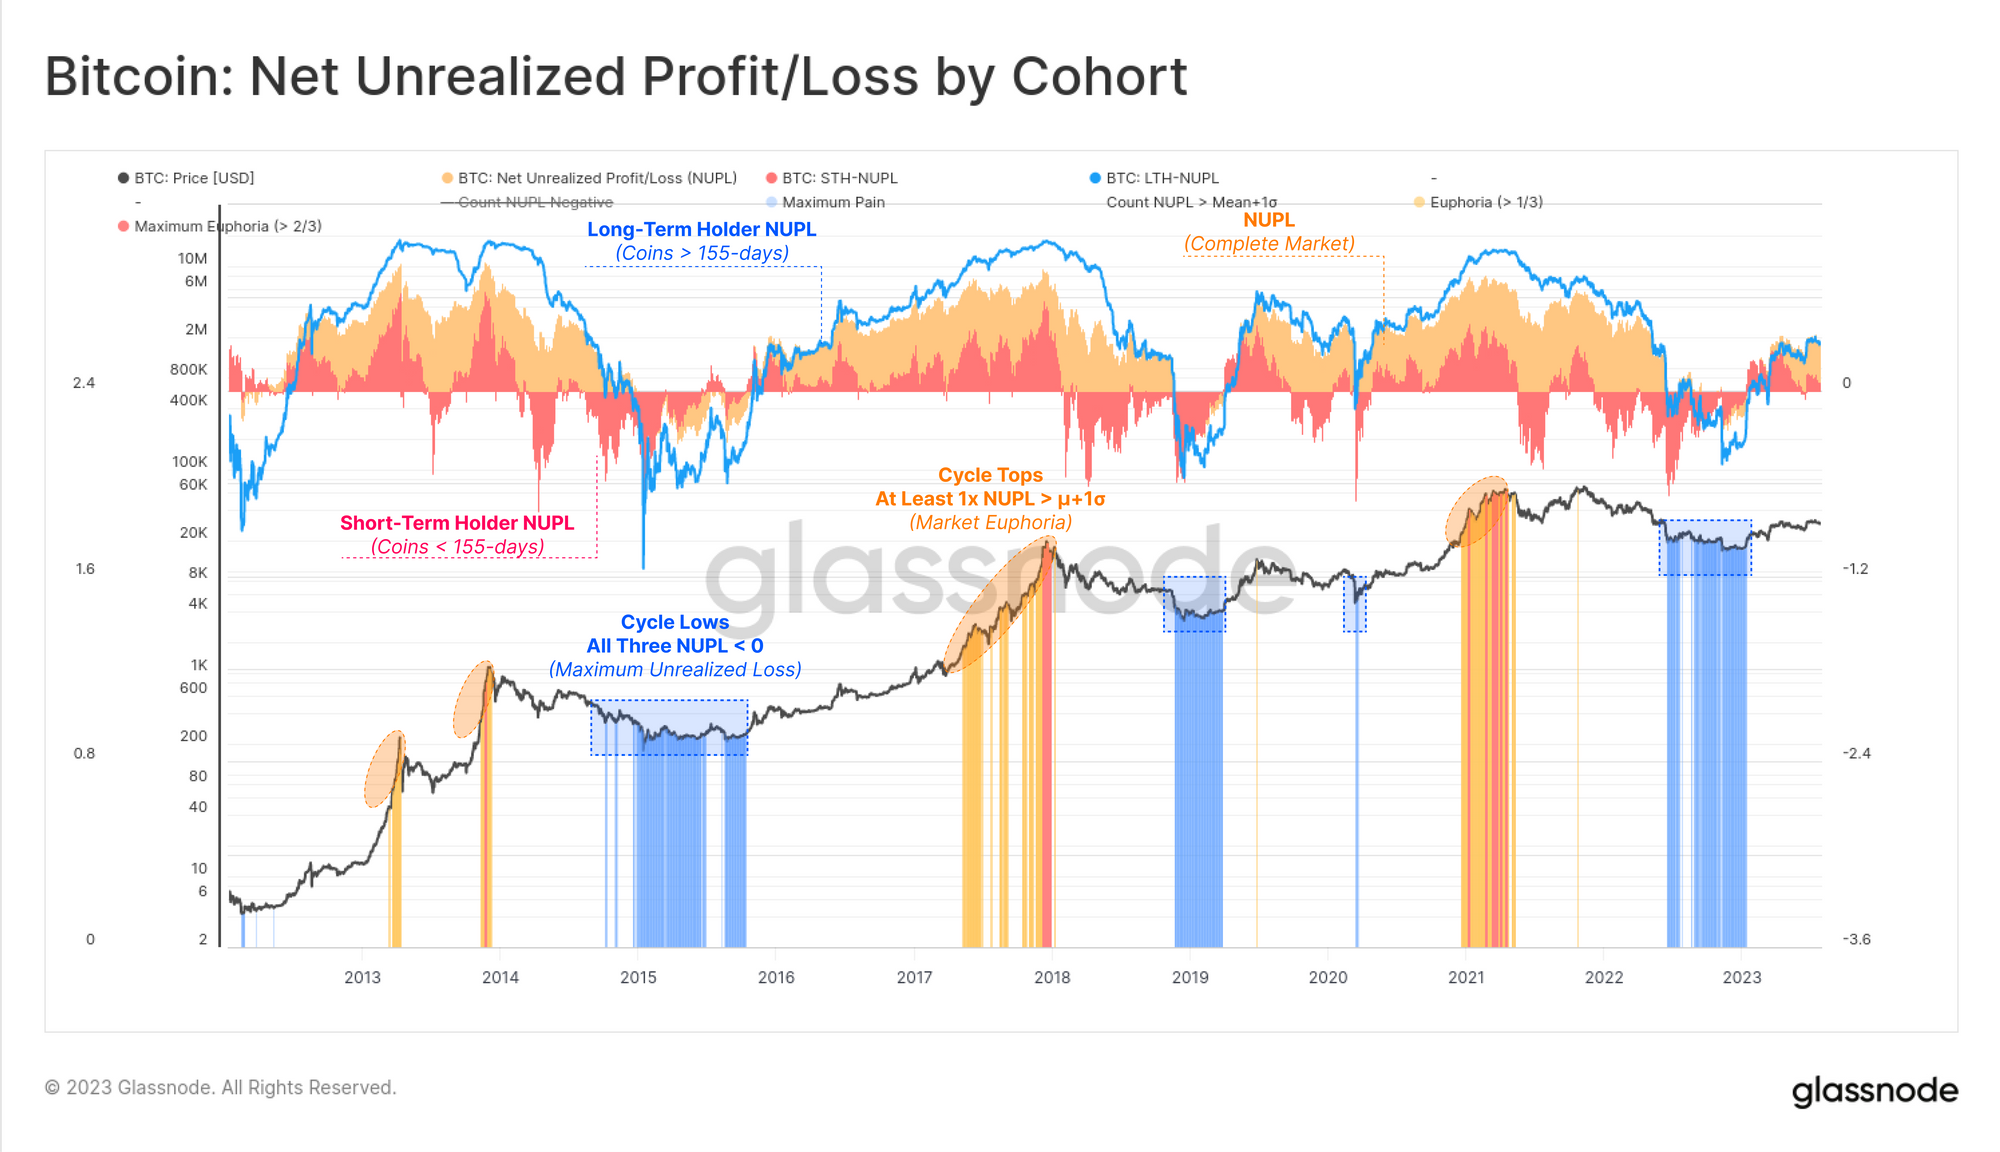
One of the most popular on-chain tools is the Net Unrealized Profit/Loss (NUPL) metric which presents the unrealized profit/loss held in the supply as a proportion of the Market Cap. Here we have presented variants of NUPL for three cohorts:
- 🟠 The entire market
- 🔴 Short-Term Holders
- 🔵 Long-Term Holders
We have also applied a set of simple rules to help identify periods of exuberance and extreme profitability in bulls, and deep despair and unrealized loss in bears.
- 🟦 All three NUPL variants are below 0 (in loss)
- 🟧 At least one NUPL variant is above the all-time mean + 1sd (in profit)
- 🟥 Two or more NUPL variants exceed the all-time mean + 1sd (extreme profit)
We can see strong confluence emerges between the incentive for investors to spend (unrealized) and their actual on-chain spending behaviour (realized). For more details on analysis of Unrealized Profit and Loss, we recommend our deep dive article on Mastering the MVRV.
Assessing Capital Flows
The drawdown experienced by the Realized Cap tends to be significantly smaller than that of the Market cap, ranging between -23% and -14% to date. This compares to the 92% to 75% drawdowns in spot prices.
This observation suggests that whilst the spot valuation may decline by -75% or more, the true capital outflows from the asset tend to be 3x-4x smaller in magnitude. This provides some argument for why Bitcoin has historically found bear market floors at increasingly elevated price ranges over time.
Realized Cap drawdowns tend to reverse around cyclical lows. This is driven largely by the capitulation event revaluing large volumes of coins to lower prices, and into the hands of higher conviction holders. Realized losses start to slow, and realized profits start to overtake in dominance. Such inflection points are well paired with observations of growing network activity, Volumes of Supply held in profit, and upticks in the Realized profit/Loss Ratio.
“Know what you own, and know why you own it.”
— Peter Lynch

This 3-4x factor is also visible in a simply study comparing how much the Market Cap has historically changed for every $1 change in the Realized Cap. The chart below is based on the following analysis framework:
- Calculate the quarterly percent change in both the Market Cap and the Realized Cap (absolute value) and take a ratio (Rcap Change / MCap Change).
- Compute both a 90-day median of this ratio (grey), as well as an all-time average (red).
- These two measures provide a long-term view on the required net capital inflow/outflow to the Realized Cap to enact a 1% change on the Market value.
We can see that the 90-day median is more volatile, and can be seen to peak above 1.0 during unsustainable uptrends. This indicates that more than $1.0 in realized capital inflow is required to maintain a $1 uptick in the asset valuation. The long-term mean however is remarkably stable, seeing a slow and gradual decline from a ratio of 0.45 in 2016 to around 0.25 today. This approximately resembles the 3x to 4x multiplier effect seen in the Realized Cap drawdown comparison.
“Booms start with some tie-in to reality, some reason which justifies the increase in asset values, and then – and this is the critical feature of speculative mood — the market loses touch with reality” – John Kenneth Galbraith

Summary and Conclusions
The process of pricestamping each unit of the supply is a toolset that is unique to on-chain analysis, enabling information dense metrics to be developed and studied. Analysts now have tools to monitor the unrealized and realized profit and loss within the supply.
In this report, we detailed how on-chain data can be used to leverage these insights and form the foundations of models of aggregate investor behaviours. Given fear and greed are the prime motivators of investor decisions, the analysis of profit and loss potential can provide remarkable clarity into the positioning and sentiment of the market.
Disclaimer: This report does not provide any investment advice. All data is provided for information and educational purposes only. No investment decision shall be based on the information provided here and you are solely responsible for your own investment decisions.

- SEO Powered Content & PR Distribution. Get Amplified Today.
- PlatoData.Network Vertical Generative Ai. Empower Yourself. Access Here.
- PlatoAiStream. Web3 Intelligence. Knowledge Amplified. Access Here.
- PlatoESG. Automotive / EVs, Carbon, CleanTech, Energy, Environment, Solar, Waste Management. Access Here.
- PlatoHealth. Biotech and Clinical Trials Intelligence. Access Here.
- ChartPrime. Elevate your Trading Game with ChartPrime. Access Here.
- BlockOffsets. Modernizing Environmental Offset Ownership. Access Here.
- Source: https://insights.glassnode.com/the-realized-cap-foundation/

