Join Our Telegram channel to stay up to date on breaking news coverage
Terra Classic (LUNC) Price Prediction – October 15
There has been a continual positive upholding of upswings in the Terra Classic market versus the US Dollar, signifying the crypto economy may secure stances at a high point as the price even moves in a correction. Following the statistical data on the Coinmarketcap site, yesterday’s low and high values are at $0.0002686 and $0.0002893. Presently, the market percentage rate is at a minute 0.04 positive.
LUNC Price Statistics:
LUNC price now – $0.00027546
LUNC market cap – $1.7 billion
LUNC circulating supply – 6.2 trillion
LUNC total supply – 6.9 trillion
Coinmarketcap ranking – #32
LUNC/USD Market
Key Levels:
Resistance levels: $0.00040000, $0.00045000, $0.00050000
Support levels: $0.00020000, $0.00015000, $0.00010000
LUNC/USD – Lon-term Chart
The LUNC/USD long-term chart reveals the crypto market may secure stances at a high trading spot around $0.0003000 level. The 14-day SMA indicator is at $0.00028720, over the $0.00022160 point of the 50-day SMA indicator. The horizontal line drew at $0.00020000 support level to markup the maximum lower-trading spot price can push below the moon side to regain energy. The Stochastic Oscillators have well positioned in the oversold region to portend the possibility of making a cross back to the north at 3.58 and 6.22 range values.
Your capital is at risk
Will the LUNC/USD market soon reverse course from where it is now trading?
Indications are on a high to suggest the possibility of the LUNC/USD trade swinging up soon from around the $0.00030000 trading spot as the crypto business operation appears to secure stances firmly near below the value line. Long-position placers may resort to a 1-hour chart and a 4-hour chart to complement the readings at lower trading zones before exerting a buying order afterward. Nevertheless, traders with a big account size may begin to execute longing positions by using the smallest lot measurement.
On the downside of the technical analysis, selling activities tend to risk featuring a chain of tinier lower lows in a consolidation manner toward the trend line of the 50-day SMA for a long time if bulls fail to make a spike in the near time as expected. Short-position placers should exercise patience by not going alongside any declining force that can emanate in pursuance of a further fall-off to make a completion.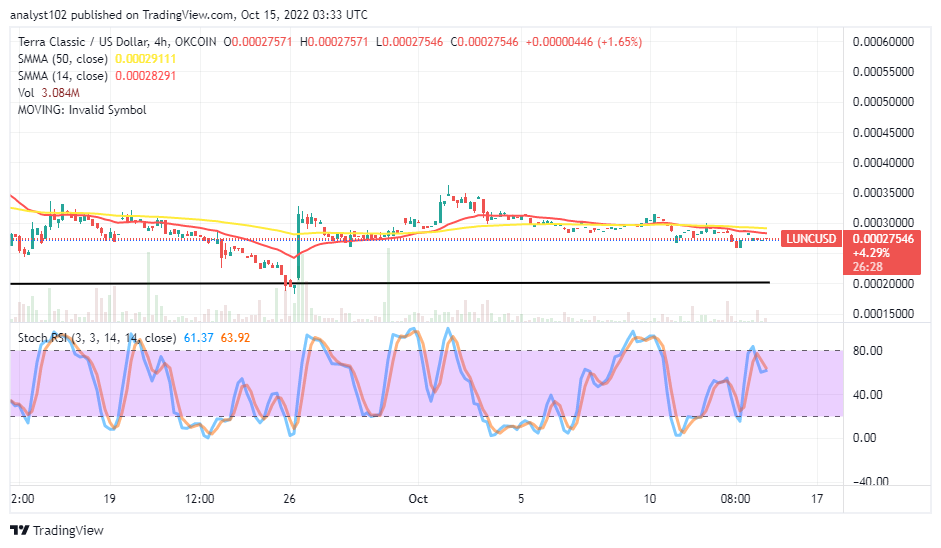
LUNC/USD Medium Chart
The LUNC/USD medium-term chart reveals the crypto economy may secure stances around the trend lines of the SMAs. The 14-day SMA indicator has slightly crossed the 50-day SMA indicator to the south. The Stochastic Oscillators have briefly moved southbound initially. And they are attempting to close their lines at 61.37 and 63.92 range values. It would be ideal technical thinking to allow the Oscillators tool to get repositioned at low-range zones before a buying order.
Tamadoge – Play to Earn Meme Coin

- Earn TAMA in Battles With Doge Pets
- Maximum Supply of 2 Bn, Token Burn
- Now Listed on OKX, Bitmart, LBank, MEXC, Uniswap
- Ultra Rare NFTs on OpenSea
Read more:
Join Our Telegram channel to stay up to date on breaking news coverage

