Executive Summary
- Bitcoin prices are consolidating around the $30k mid-point of the 2021-23 cycle, with YTD price performance remaining historically strong.
- Inscriptions have cooled off significantly and Bitcoin network congestion is starting to clear. However monetary transfer volumes are increasing, now up +75% since the November lows.
- The balance of supply held in-profit vs in-loss has reached an equilibrium point synonymous with the several month long ‘re-accumulation period’ seen in past cycles.
🪟 View all charts covered in this report in The Week On-chain Dashboard.
Holding Up OK
The Bitcoin market has held onto the majority of its 2023 gains thus far, rallying back above $31k in recent weeks. With the market consolidating near the yearly highs, we can compare this price performance to prior cycles, from both a bull and a bear market lens.
If we assume that the November 2022 lows are indeed the cycle floor, we can compare the depth of the ‘bull market corrections’ thus far. We can see that the peak drawdown in 2023 has been just -18%, which is remarkably shallow compared to all prior cycles. This perhaps suggests a relatively strong degree of demand underlies the asset.

If we instead put our bear market goggles on, we can assess 2023 performance indexed from the cycle ATH. From this vantage point, the powerful recovery from the November lows is up 91%, and carries a remarkable resemblance to the recovery rallies of prior cycles.
With the exception of 2019, all prior cycles which experienced a similar magnitude move off the bottom, were in fact the genesis point of a new cyclical uptrend.

Inscriptions Give Way to Investors
One of the most surprising events of 2023 has been the emergence of ordinals and inscriptions on Bitcoin. This phenomena has experienced two distinct waves of activity:
- Wave 1: Primarily image based inscriptions, leading to the emergence of NFT assets on Bitcoin. A total of 1.08M images have been inscribed thus far.
- Wave 2: Primarily high fee paying text based inscriptions associated with ‘BRC-20 tokens’. Overall, Bitcoin now hosts 14.8M text based inscriptions.
By inscription count, Wave 2 was an order of magnitude larger, however activity has been in consistent decline since May. There has been a brief uptick in text inscriptions this week, however unconfirmed transactions across Bitcoin mempools are starting to clear overall.

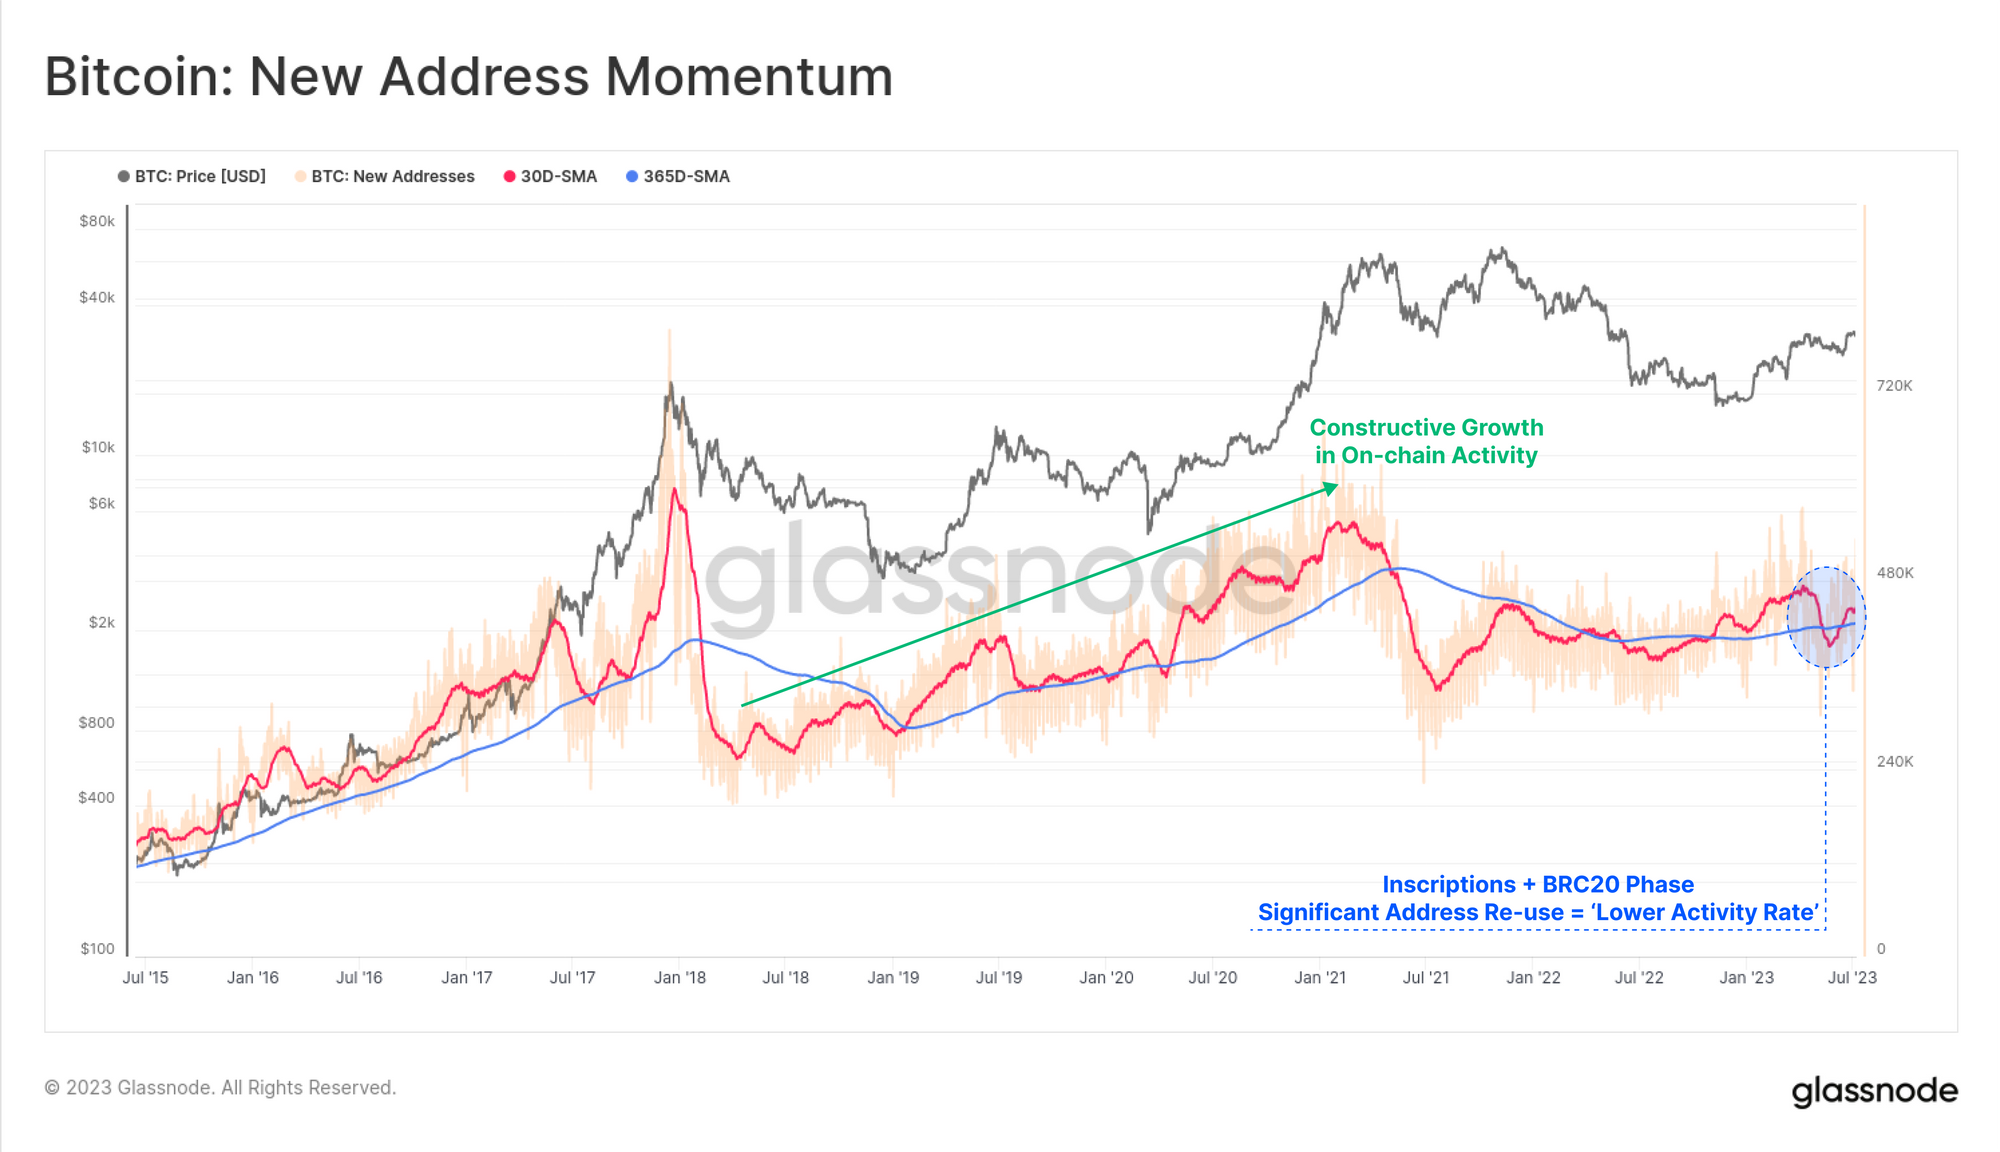
Inscriptions also forced a very intriguing development in our interpretation framework of on-chain activity metrics. Generally speaking, upticks in Bitcoin on-chain activity metrics are a signal of growing adoption and a healthy network (i.e. up is usually good to see).
However due to the significant address re-use (WoC 20), and very small transfer volumes (~10k sats) associated with inscriptions, periods of high demand now requires a slightly more nuanced interpretation, summarised in the following table.

With this in mind, we can see that as inscriptions cool off, active address momentum has started climbing again. Traditional interpretation would have seen the last 2-3 months as an implied decline in Bitcoin network activity. However the correct interpretation is that it was simply a product of significant address re-use by inscription traders, and network activity was actually booming, with blocks being packed full.
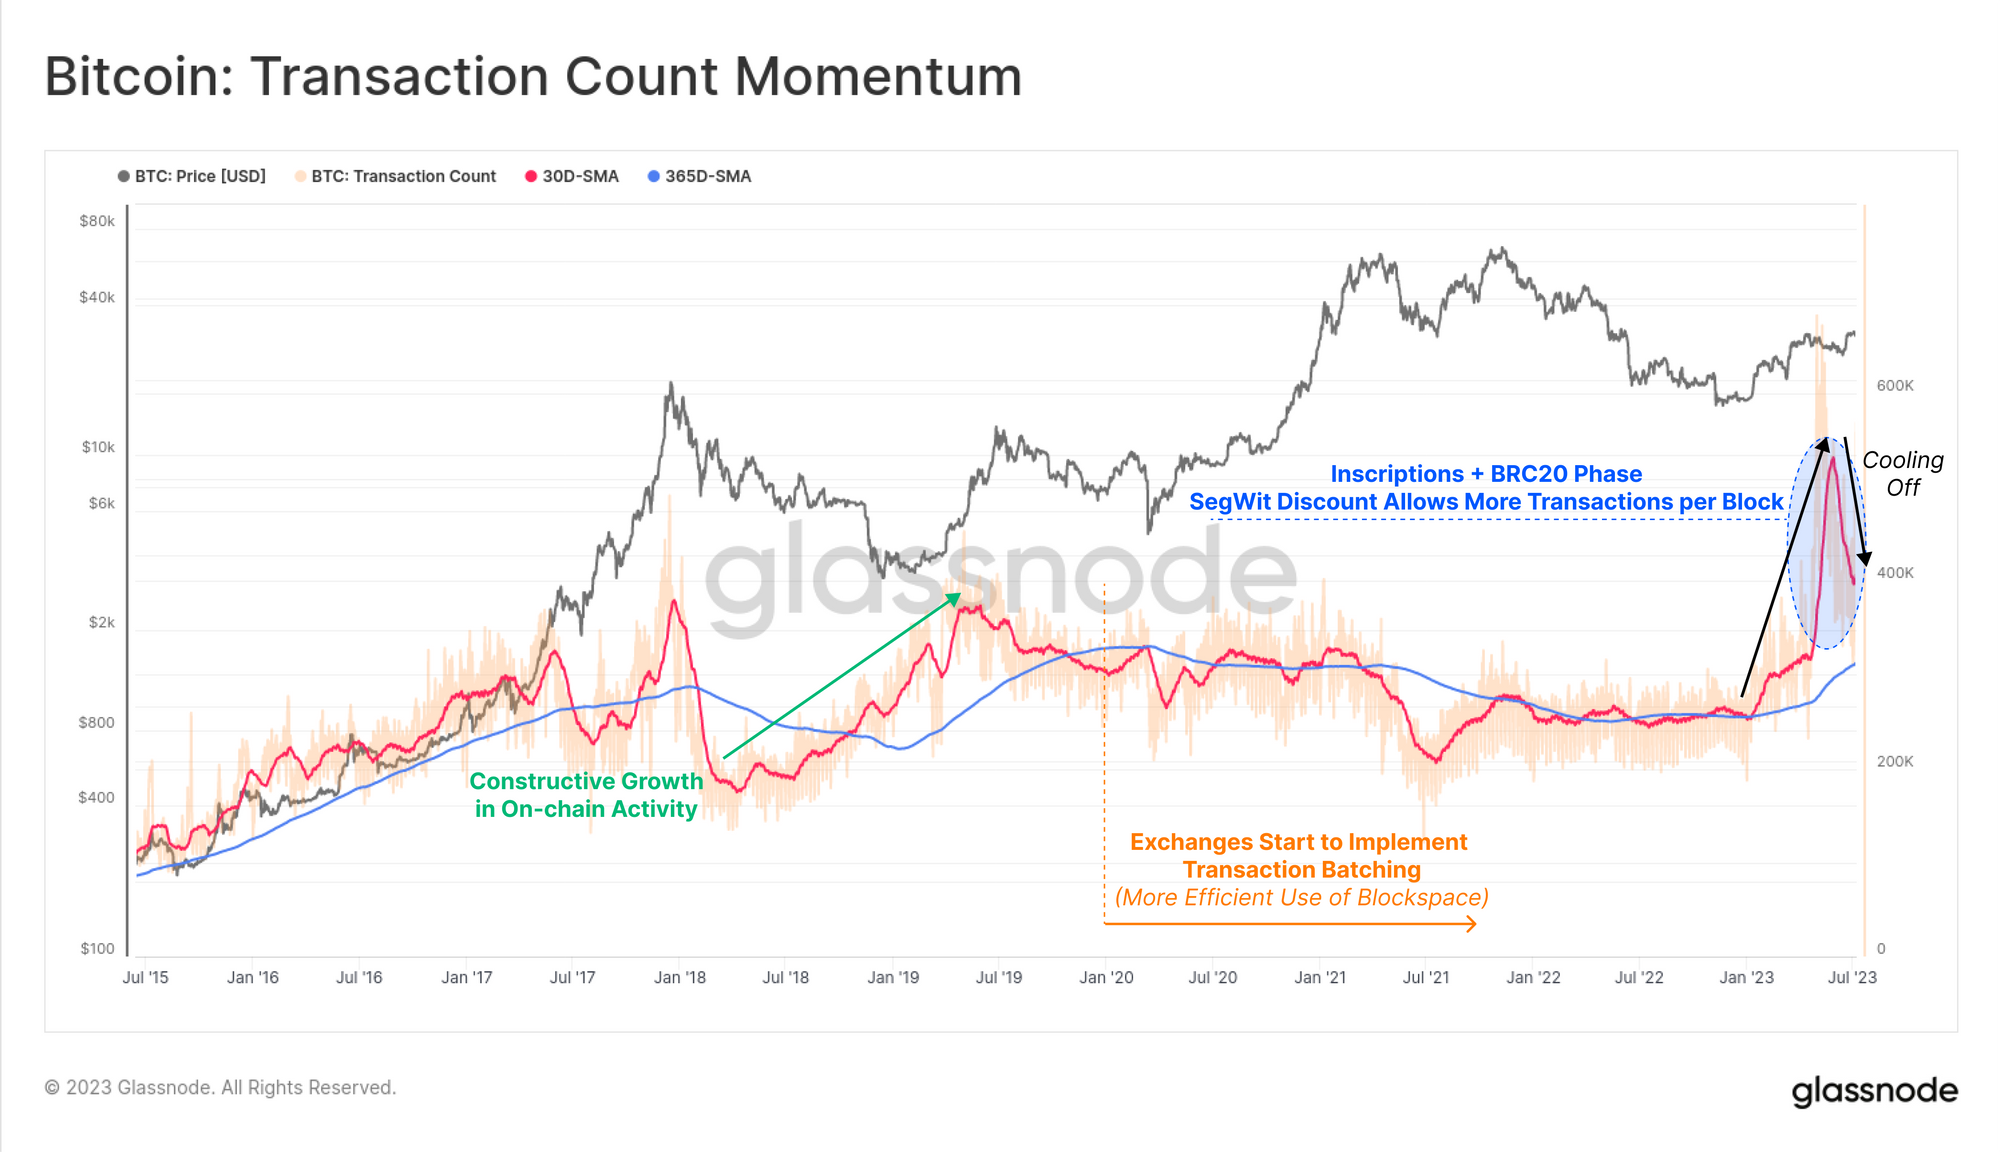
Transaction counts also reached a previously unattainable peak, with inscriptions taking advantage of the SegWit data discount. This meant that miners could fit more transaction data into each block, with some blocks even approaching the 4MB theoretical hard limit.
Daily transaction counts have also cooled off significantly in recent weeks, aligning with the slowdown in inscription activity.
After several months of network congestion, mempools are slowly but surely starting to clear, and on-chain transaction fees are coming off the boil. USD denominated transaction fees on Bitcoin are down over 96% since the height of the BRC-20 craze in May, with the average fee paid now at $1.33, with median fees down to $0.16.
Fee metrics, above all others, suggests an aggregate slowdown in on-chain activity is currently underway.

Whilst activity is cooling, BTC volumes which are being transferred are starting to pick up meaningfully. BTC changing hands has lifted 75% off the FTX lows, now reaching $4.2B per day in total settlement.

If we isolate only exchange inflows and outflows, we see that the Bitcoin network is entering a period of positive momentum. The monthly average of exchange flows is now firmly above the yearly, a sign that has historically suggested growing adoption from a monetary asset standpoint.
Whilst several other on-chain activity metrics are cooling off, this one suggests a return back towards a dominance of BTC monetary transfers.

From this exchange related activity, we can develop an NVT Price model. originally developed by Will Woo. This model seeks to imply a ‘fair value’ for a given amount of on-chain volume settlement.
On a short-term 28-day basis, this model implies a ‘fair value’ of $35.9k, which is above spot prices for the first time since November 2022. The slower 90-day model is also turning sharply higher, and playing catch up from a level of $24.7k.

Firm Foundations
Thus far, we have established that the recovery of the Bitcoin market in 2023 has been remarkably robust, both from a price performance, but also from a network utilisation standpoint. The chart below helps put this into perspective, demonstrating the firm foundation of supply that was acquired at prices below $30k.
We can see that the supply cluster between $15k and $30k is quite significant, demonstrating that a large volume of coin changed hands over the last 12 months. Conversely, just 25% of the supply was acquired at prices above $30k, held by buyers from the 2021-22 cycle.

We can bring the Long and Short-Term heuristic into our URPD chart, making the following observations:
- 🔵 A sizeable volume of LTH supply was acquired between $15k and $25k (thus in profit), and remains unspent, despite prices reaching $31k.
- 🔵 Almost all coins with an acquisition price above $30k are held by LTHs. These investors are the survivors of the 2021-22 bear, and are either battle hardened HODLers, or likely to create resistance should the market rally higher.
- 🔴 The price range between $20k and $30k has seen expanding accumulation since February, despite the onslaught of regulatory pressure in the US.
Overall, this supply distribution is quite ‘bottom heavy’ suggesting a relatively firm ‘foundation’ of investor holdings exists below $30k.

We can also see the magnitude of supply acquired during the recent correction to $25k in the chart below. The volume of supply which jumped from ‘in-loss’ to ‘in-profit’ status was around 2.47M BTC, equivalent to 12.7% of the total supply.
Conversely, the supply held ‘in-loss’ has declined to just 4.79M BTC, reaching similar levels seen in July 2021 ($30k), July 2020 ($9.2k), April 2016 ($6.5k), and March 2016 ($425).

Stuck In the Middle
Bitcoin data often displays strangely repetitive patterns cycle after cycle. In the 2021-22 cycle, the $30k price level formed somewhat of a ‘mid-point’, and was tested several times both from above and below.
A very similar level was observed in 2013-16 around the $425 level, and again in 2018-19 at approximately $6.5k. Note also that these levels were mentioned above, as points where a similar volume of supply was held ‘in-loss’.

With the market consolidating below this $30k ‘mid-point’, we can see that around 75% of the total supply is in-profit, and 25% is held in-loss. This is, strangely, the same balance reached as price reached the mid-points in both 2016 and 2019.
In fact, this 75:25 balance of supply held in profit:loss is the equilibrium point for Bitcoin. 50% of all trading days have seen a higher Profit-to-Loss balance, and 50% a lower one.

This equilibrium point has historically taken time for the market to digest, and re-consolidate around. Many Bitcoin analysts refer to this as the ‘re-accumulation period’, which tends to straddle the halving event.
We can visualize this by looking at proportion of the Market cap held at an Unrealized Loss. During the primary bear, the market is plunged deep into the red, with investors gradually capitulating out. As the market forms and then rallies off the lows, profitability sees a sharp recovery, reaching levels similar to where we are today.
Previous ‘re-accumulation periods’ are characterised by a lack of macro market direction, tending to trade sideways (and volatile) for several months. With the market back at this equilibrium point, it remains to be seen if a similar lengthy and choppy process is needed to overcome it.

Summary and Conclusions
Bitcoin is currently consolidating below the 2021-22 cycle mid-point of $30k, with several metrics reaching a level of equilibrium and balance. This is synonymous with the ‘re-accumulation period’ seen in past cycles, characterised as several months with little macro direction.
Price performance YTD has however been relatively strong, with a maximum drawdown of just -18% so far. On-chain activity for Bitcoin is cooling down somewhat, driven most by a decline in Inscription activity. Monetary transfer volumes however are starting to pick up, displaying positive momentum often associated with growing liquidity and adoption.
Disclaimer: This report does not provide any investment advice. All data is provided for information and educational purposes only. No investment decision shall be based on the information provided here and you are solely responsible for your own investment decisions.

- SEO Powered Content & PR Distribution. Get Amplified Today.
- PlatoData.Network Vertical Generative Ai. Empower Yourself. Access Here.
- PlatoAiStream. Web3 Intelligence. Knowledge Amplified. Access Here.
- PlatoESG. Automotive / EVs, Carbon, CleanTech, Energy, Environment, Solar, Waste Management. Access Here.
- BlockOffsets. Modernizing Environmental Offset Ownership. Access Here.
- Source: https://insights.glassnode.com/the-week-onchain-week-28-2023/

