Executive Summary
- Bitcoins recovery is near completion as capital continues to pour into the asset class, propelling the Realized Cap to $460B, and only 3% shy of its ATH.
- Exchange inflow volumes are near all-time-highs, with Short-Term Holders dominating the flows. This suggests a relatively strong demand for speculation and trading activity.
- Open interest in both futures and options markets are also near all-time-highs, and directional short-sellers continue to bet against the uptrend, resulting in over $465M in liquidation volume over the last 30-days.
Capital Flows
The Bitcoin price continues consolidating just below $52k, having held onto the majority of its gains since mid-February. Supporting this performance is what appears to be a steady and healthy inflow of capital into the asset, with the Realized Cap climbing by over $30B YTD. This places the total valuation of the Realized Cap at $460B, which is just 3% shy of the previous ATH.
💡

As a result of this strong performance, the profitability of Bitcoin investors has improved markedly, with the average investor now holding an unrealized profit of +120% per coin.
The MVRV Ratio allows us to measure this, with values of this magnitude often seen during the early innings of prior bull markets. Around 1126-of-4965 trading days (22.7%) have seen MVRV record a larger unrealized profit. The air above the market is certainly getting thinner, but it is by no means uncharted.

With the market largely in a state of unrealized profit, it becomes prudent to evaluate how participants have responded. For this, we can employ a suite of SOPR metrics, which assess the average magnitude of realized profit or loss by cohort.
🟠 Market Average SOPR: 1.13 (+13% profit)
🔵 Long-Term Holder-SOPR: 2.07 (+107% profit)
🔴 Short-Term Holder-SOPR: 1.02 (+2% profit)
All cohorts are currently locking in meaningful realizing profits, which is typical of an uptrending market (highlighted in 🟧). We have also flagged periods of time where all three SOPR variants exceed their current value in the past (in 🟥). We can see these align with the most euphoric phase of the 2017 and 2021 bull markets, a similar observation to MVRV above.

Exchanges
With market momentum intensifying, and investors holding their largest unrealized gains since the Nov 2022 ATH, we can turn to inflows into the major exchanges as a measure for trading activity and speculation.
The total volume of deposits and withdrawals has continued to expand, reaching a staggering $5.57B in daily volume flowing in and out of exchanges, rivalling activity seen during the Nov 2022 market ATH.

We can increase the granularity of the above observation by segrating inflows to Exchanges by on-chain cohorts, allowing us to characterize the source of the deposits. The breakdown of total exchange deposit volume is as follows:
🔴 Short-Term Holders +$2.1B
🔵 Long-Term Holders +$120M
🟢 Inter Exchange Volume +$354M
The STH Cohort have consistently deposited over $2B per day in volume since mid-January, whilst also setting a new ATH of $2.46B in volume deposited overall. This underscores a high degree of speculative interest within the current market structure.

Further confluence can be found by evaluating the percentage of the overall STH balance sent to exchanges. Since Oct 2023, the STH cohort have been depositing upwards of 1% of their supply per day, peaking at a value 2.36% during the recent ETF led speculation. This is largest relative deposit since the March 2020 sell-off.

The degree of speculation within the current market can also be seen by the extraordinarily high dominance of exchanges related in/outflows with respect to all on-chain volume. Currently, 78.3% of all economical on-chain volume is being directed to/from exchanges, which is coming off a new ATH.
Note, economical volume is defined as our entity-adjusted on-chain volume, which filters out internal transfers, wallet management, and self-spends to our best estimate.

The new spot Bitcoin ETF products have also created a new source of demand for BTC, with an incredible +90K BTC in net flows migrating into the ETFs. These inflows account for a staggering $5.7B, and bring the total AUM of the ETFs to nearly $38B.
These ETF products have for the first time allowed institutional investors to gain exposure to the BTC asset via traditional rails, opening a new degree of freedom for demand and speculation.

Derivatives Overview
Alongside the uptick in speculation visible in on-chain flows, we can also see that derivative markets have responded similarly. The total Open Interest in futures markets has risen to a value of $21B, with only 84-of-1195 trading days (7%) recording a higher value.
The USD denominated value of open futures contracts is approaching the highs seen during the most euphoric periods of 2021.

Options markets have also experienced significant growth, with open interest hitting $17.5B. This is on a comparative footing to the $21B in futures markets, which is a relatively new development since 2023.
The growth in options markets suggests that Bitcoin derivative markets are becoming increasingly mature, with investors, traders, and miners now having deeper and more liquid options to hedge and manage risk.

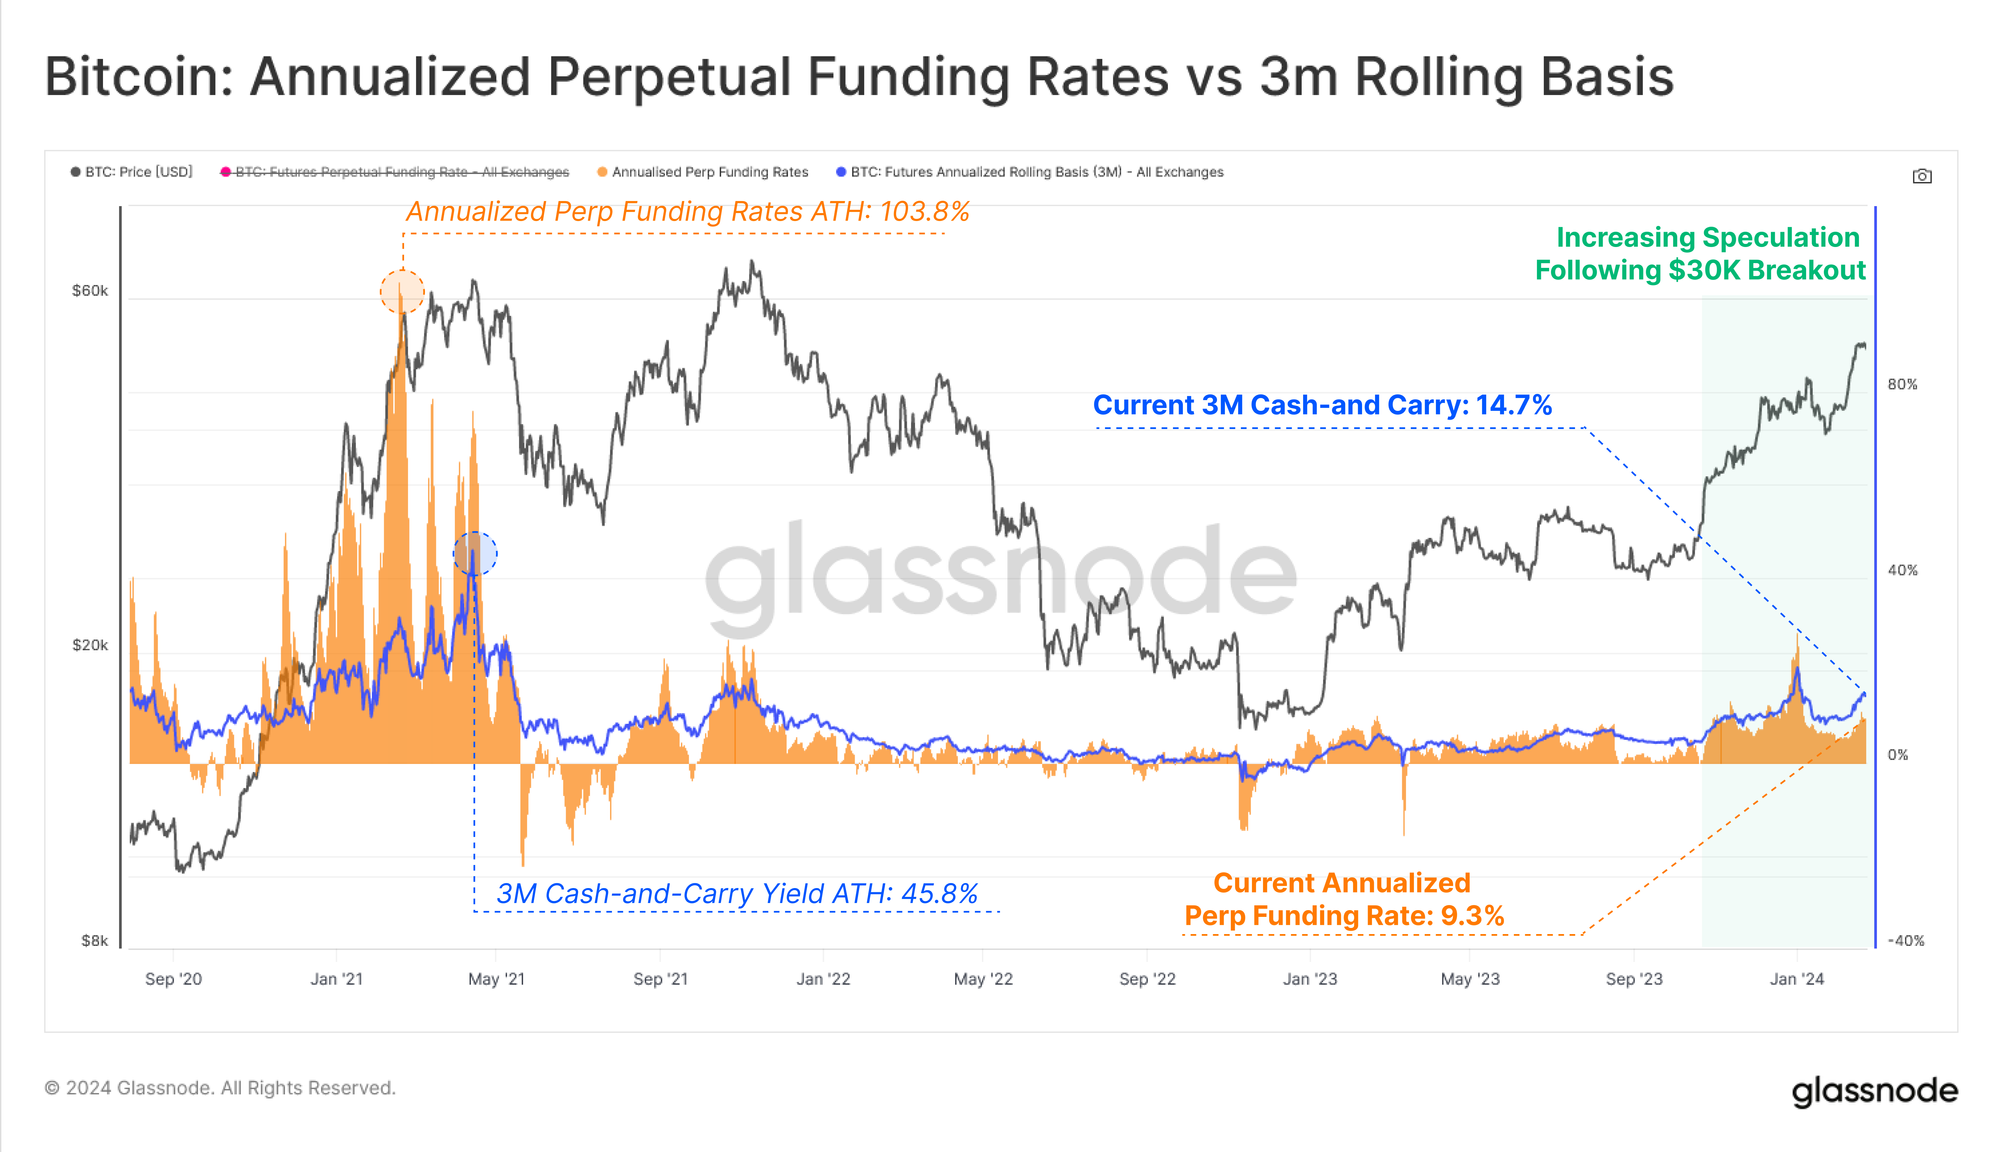
The decisive breakout through $30k in October last year was a key point of interest, with notable changes across many parts of the Bitcoin market.
Prior to this rally, the yield available via a cash-and-carry strategy in futures markets was barely above 3% on a sustained basis, being less than the risk free rate available in US treasuries. Since then however, cash-and-carry yields have increased to 14.7%, providing a few indications:
- Traders are willing to pay much higher interest rates to take on leveraged long positions.
- The short-side is now able to capture 2x-3x the ‘risk-free’ rate available in short term US Treasuries.
- The yield available in futures markets is likely to start attracting market makers back into the digital asset space, deepening market liquidity.
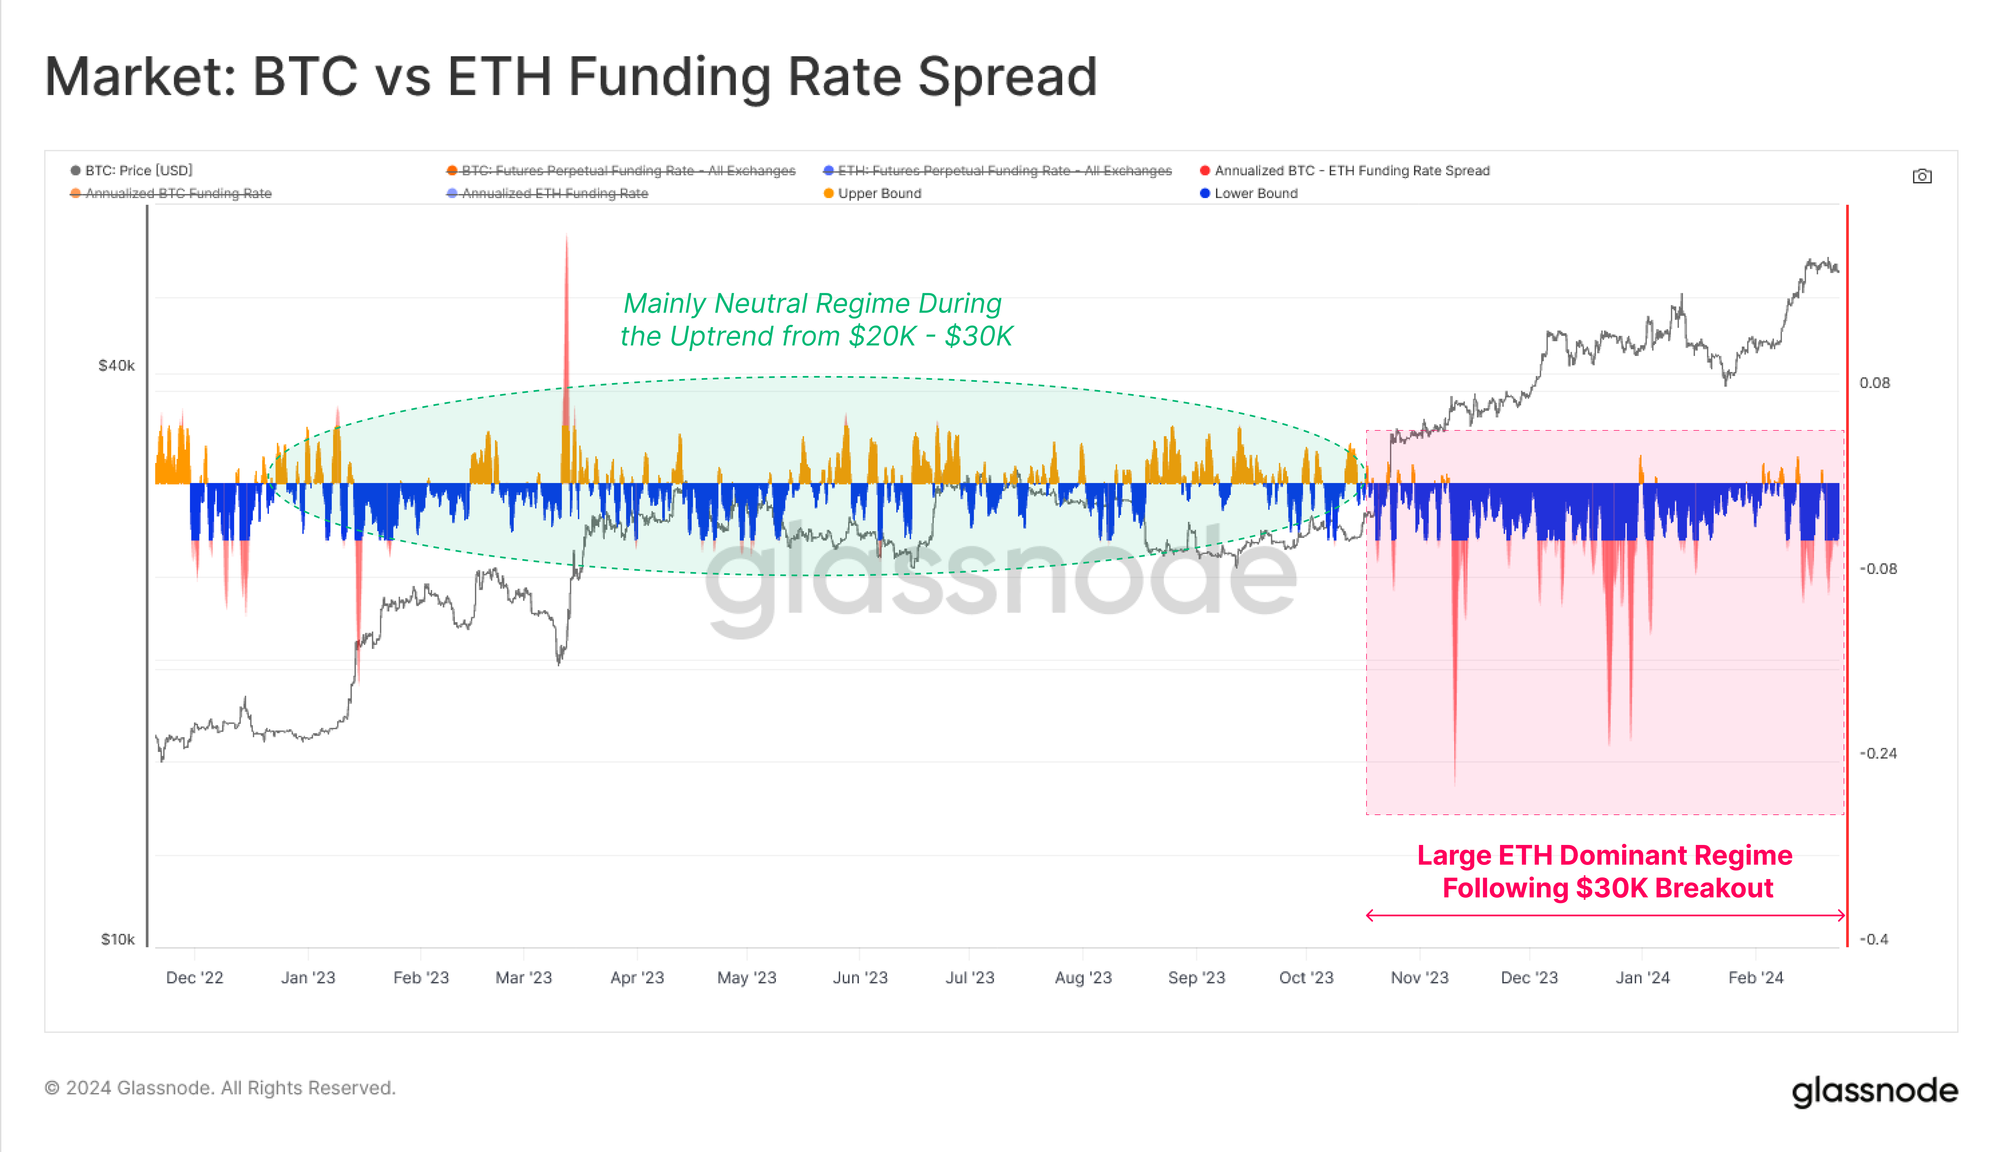
The spread between BTC and ETH funding rates is also is widening. Prior to October-2023, a relatively neutral regime can be observed, where the spread oscillated between positive and negative state.
However, since the October rally, funding rates for ETH have been consistently higher than for BTC, inferring an increased appetite by traders to speculate further out on the risk curve.
We have also seen a regime of heavy short liquidation dominance during the rallies into ETF approvals. Whilst market neutral cash-and-carry traders are being attracted to the short-side, the market is still seeing directional short-sellers being liquidated at a higher rate than longs.
It is worth noting that at both ATH peaks in 2021, long traders dominated liquidation volumes, as leveraged positions were force closed within the intra-day volatility. As such, seeing such a strong dominance of directional short traders being liquidated suggests many traders have been betting against the prevailing uptrend since October.
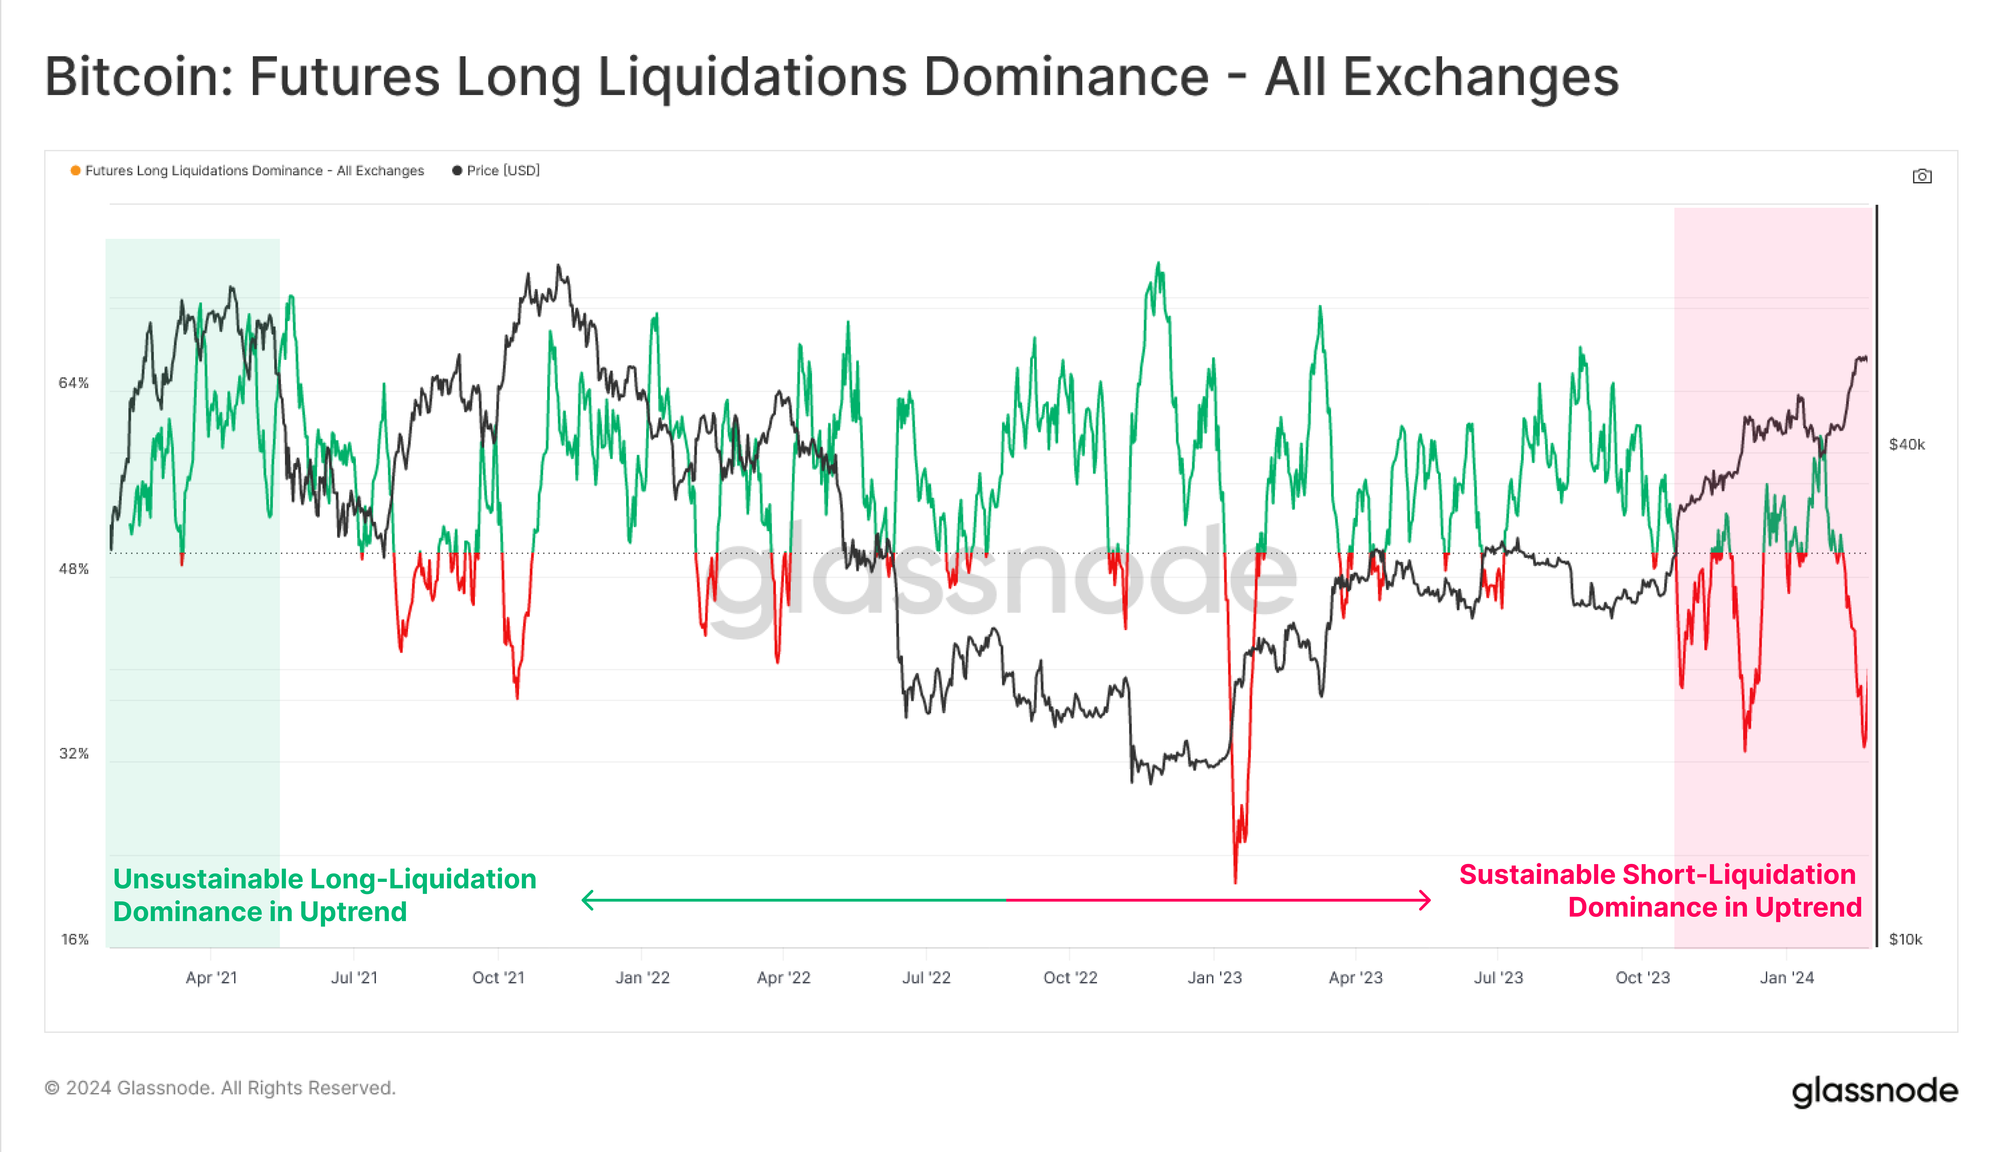
This has led to a substantial growth in the the total short-side liquidations over the last 30-days, with over $465M in closed positions. The chart below highlights periods where short liquidations exceed those of longs, many of which align with powerful uptrends fuelled by short-squeezes.

Summary and Conclusions
In lieu of the highest spot prices since Dec-2021, risk appetite amongst market participants has returned in style. This is highlighted by an acceleration of capital inflows, and a increasing activity amongst the Short-Term Holder cohort, whom are depositing over $2B of volume to exchanges per day.
Speculation activity is also present across derivative instruments, with both options and futures open interest being just shy of ATHs. With perpetual funding rates now providing yields in excess of 2x to 3x the risk free rate of US treasuries, there has been an uplift in liquidity and short-side interest. However, much of this appears to be directional, as many traders continue to bet against the prevailing uptrend (being liquidated as a result).
- SEO Powered Content & PR Distribution. Get Amplified Today.
- PlatoData.Network Vertical Generative Ai. Empower Yourself. Access Here.
- PlatoAiStream. Web3 Intelligence. Knowledge Amplified. Access Here.
- PlatoESG. Carbon, CleanTech, Energy, Environment, Solar, Waste Management. Access Here.
- PlatoHealth. Biotech and Clinical Trials Intelligence. Access Here.
- Source: https://insights.glassnode.com/the-week-onchain-week-09-2024/

