
Published 7 hours ago
Under the influence of a downsloping trendline, the Shiba Inu coin price has managed a steady downfall for nearly two months. However, with the increasing uncertainty in the crypto market, the price trend has shifted sideways and showed the formation of a descending triangle pattern. Here’s how this pattern may encourage further price movement in the Shiba Inu coin.
Key Points:
- A potential breakdown below $0.0000103 could encourage sellers to a 17.5% downfall
- A potential bearish crossover between the 50-and-100-day EMA encourages the Shiba Inu coin for extended downfall.
- The intraday trading volume of the Shiba Inu coin is $301.2 Million, indicating a 3.5% gain.
Source- Tradingview
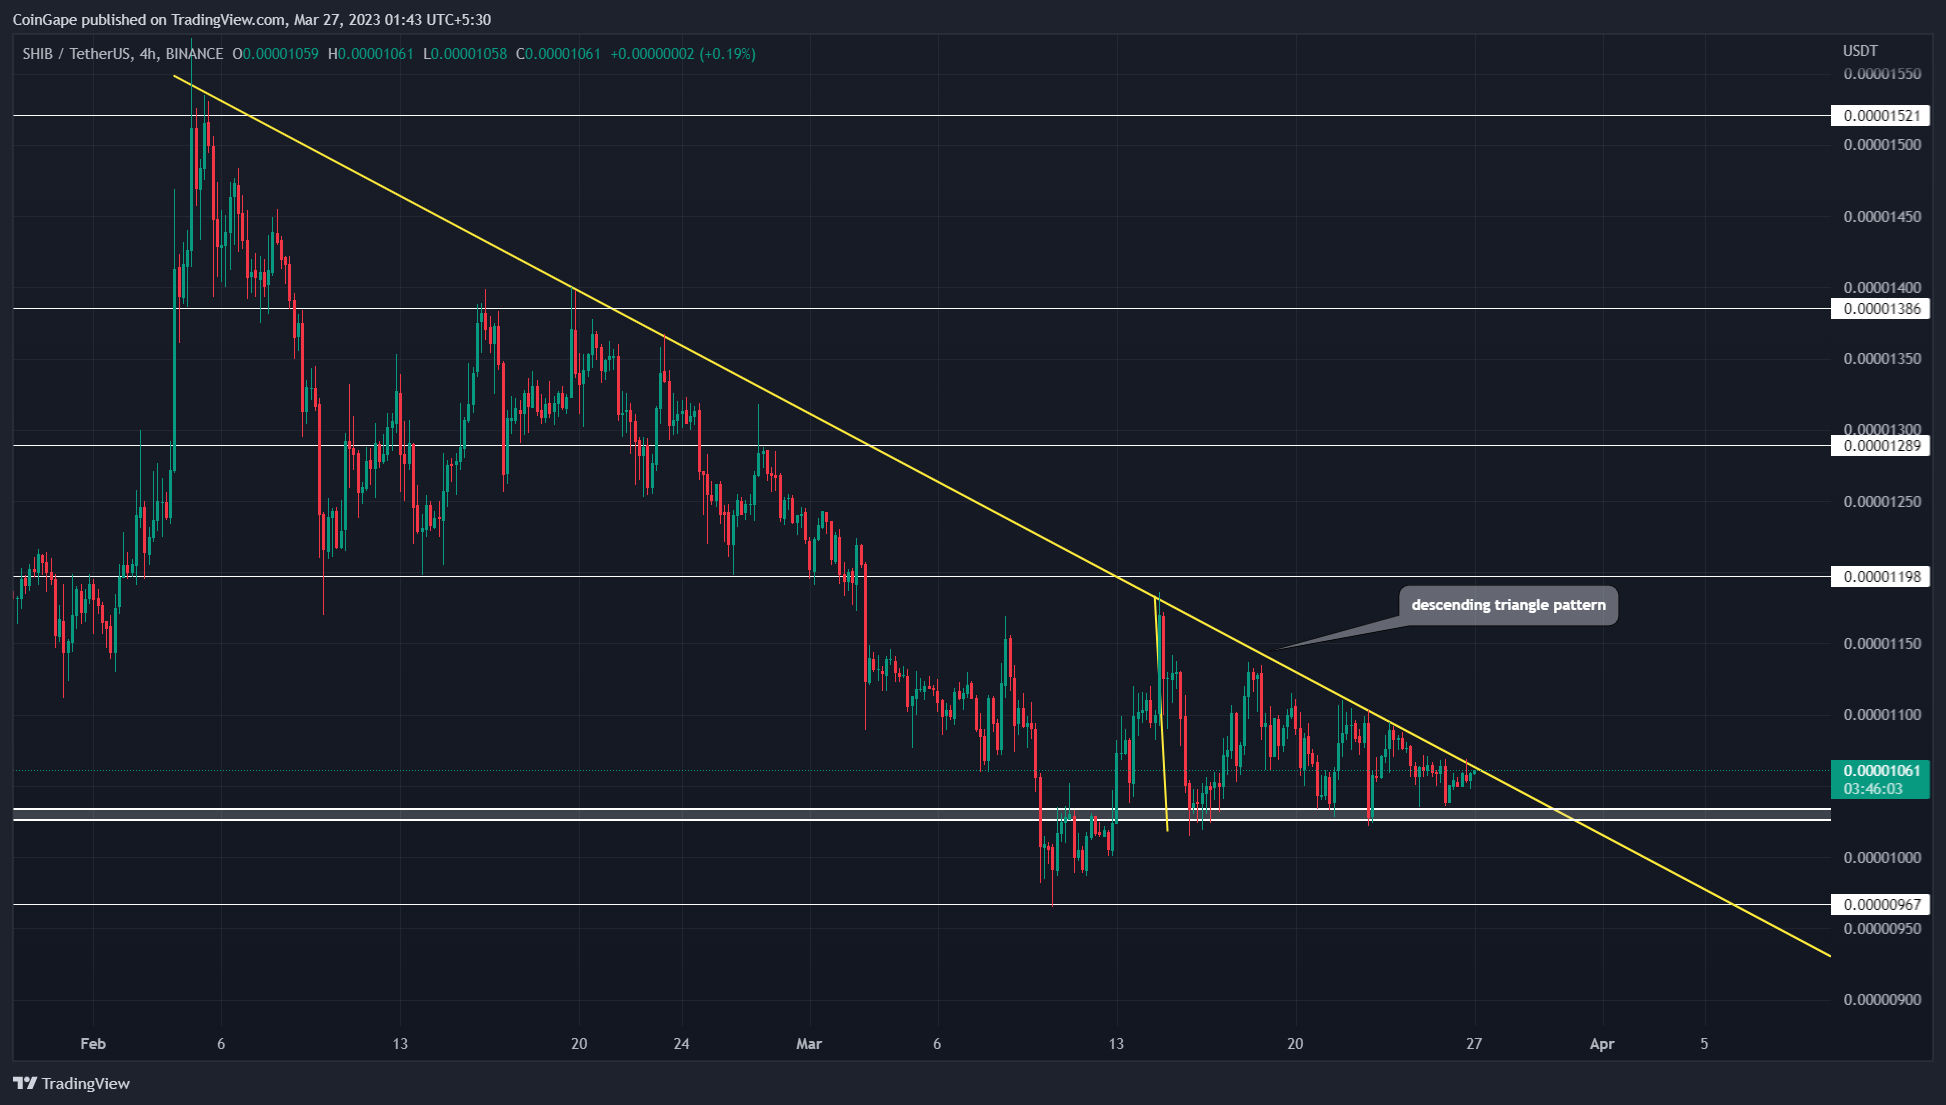
The 4-hour time frame chart gives a clear look that the SHIB price is actively responding to two technical levels, a long-coming resistance trendline and horizontal support of $0.00001035-$0.0000103.
Trending Stories
Thus, the lower low formation due to the resistance trendline and fixed horizontal support (neckline) indicates the formation of a descending triangle pattern. In theory, this pattern is a bearish continuation pattern that promotes a prolonged downfall upon the breakdown of neckline support.
As of now, the Shiba coin price trades at the $0.00001057 mark and is tightly squeezed between the pattern’s key barriers ready to give a breakout trade. With a higher possibility, this memecoin is likely to break the $0.0000103 neckline which will release the trapped bearish momentum and offer a short selling opportunity to traders.
The post-breakdown fall can drive the price 17.5% down to hit $0.0000087 while sellers can maintain a stop loss slightly above the breakdown point which is around $0.0000105-$0.0000106.
Also Read: Top 6 Liquid Staking Platforms On Ethereum
On a contrary note, interested buyers looking for an entry opportunity need to wait for the overhead trendline breakout before entering the market.
Technical indicator
Source- Tradingview
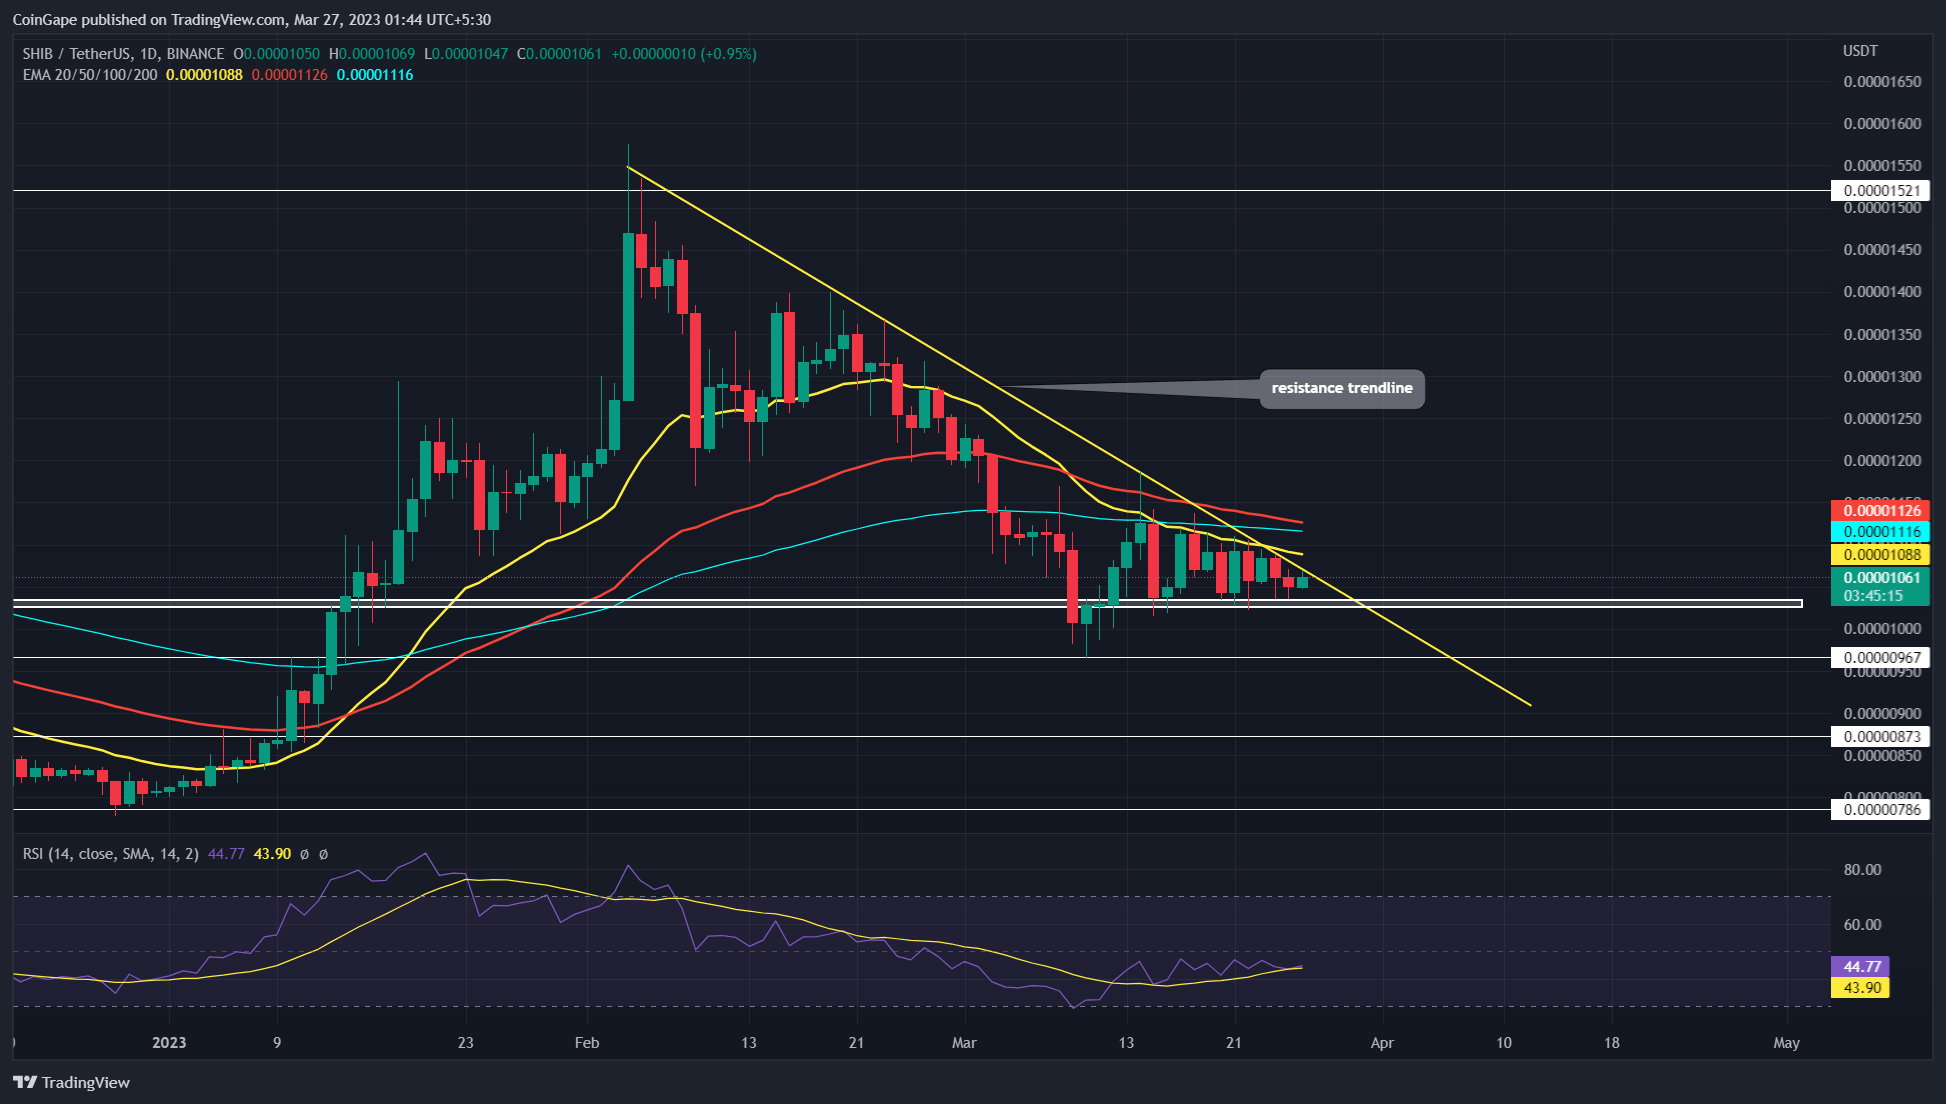
Relative strength index – The daily RSI slope below the midline reflects the market sentiment is in the seller’s favor.
EMAs: the 20-day EMA acts as a dynamic resistance and can assist sellers to maintain a sustained downfall.
Shiba Inu Coin Price Intraday Levels
- Spot rate: $0.00001059
- Trend: Bullish
- Volatility: High
- Resistance levels- $0.000012 and $0.000013
- Support levels: $0.0000103 and $0.00000965
Share this article on:
advertisement
The presented content may include the personal opinion of the author and is subject to market condition. Do your market research before investing in cryptocurrencies. The author or the publication does not hold any responsibility for your personal financial loss.
<!– Close Story–>
- SEO Powered Content & PR Distribution. Get Amplified Today.
- Platoblockchain. Web3 Metaverse Intelligence. Knowledge Amplified. Access Here.
- Source: https://coingape.com/markets/shiba-inu-price-analysis-guide-coming-week-entry-and-stoploss/

