- SHIB price is influenced by bullish supremacy as it rises by more than 1.76%
- Recent data indicates that bulls will continue to rule the Shiba Inu market
- If the price of SHIB breaks over the $0.000009376 resistance level, it could soar higher
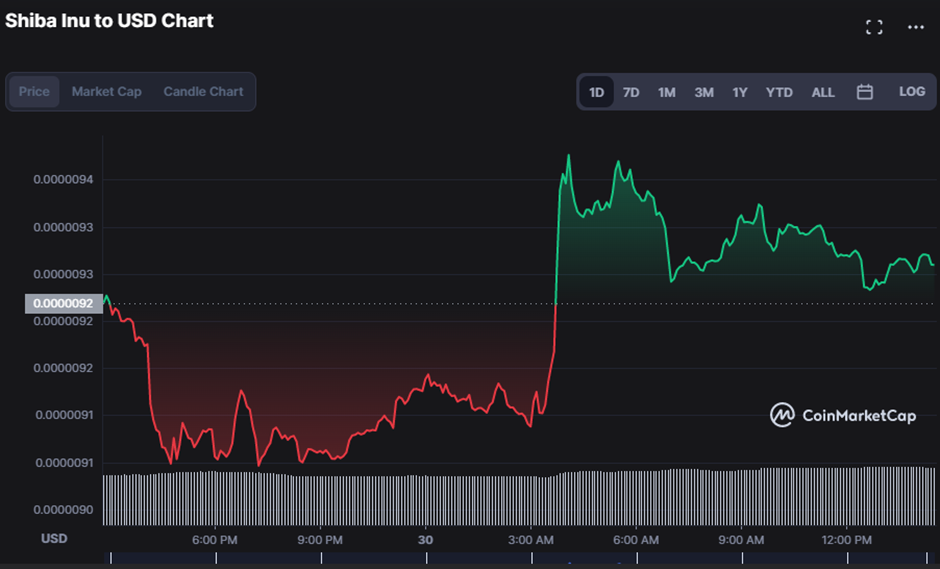
After a decline and sell-off in the previous few hours, Shiba Inu (SHIB) bulls were able to steadily raise the price of the digital currency. As of press time, there had been a 1.76% upswing to value at $0.000009191.
Market capitalization increased during the upswing by 0.29% to $5,080,326,640. The 24-hour trading volume, which increased by 15.01% to $156,172,956, contributed to this upward trend. The rising trading volume shows that there is more buying pressure as investor demand drives the SHIB price up.
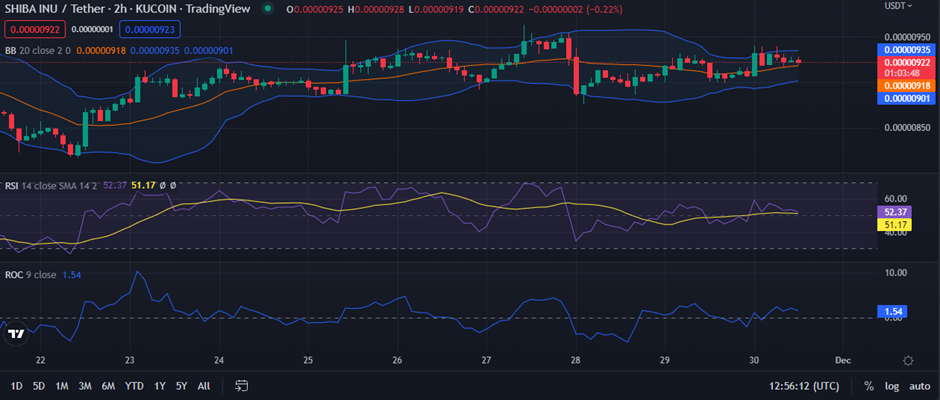
The linear motion of the Bollinger Bands, with the upper band touching $0.00000939 and the lower bands touching $0.00000903, reflect the stability in the SHIB market. It is anticipated that the bullish trend in SHIB will continue as the market price advances toward the upper band.
When the RSI line is above the RSI SMA line and has a reading of 52.93, a bullish flag is generated by the indicator. The market appears to be stable, which, combined with the RSI’s movement, suggests that the bullish ascent will probably continue.
This bullish momentum in the SHIB market is supported by the Rate of Change (ROC), which is moving in the positive region. However, the ROC is moving south with a value of 1.54, indicating that this bullish momentum may reverse if the ROC line crosses below the “0” line.
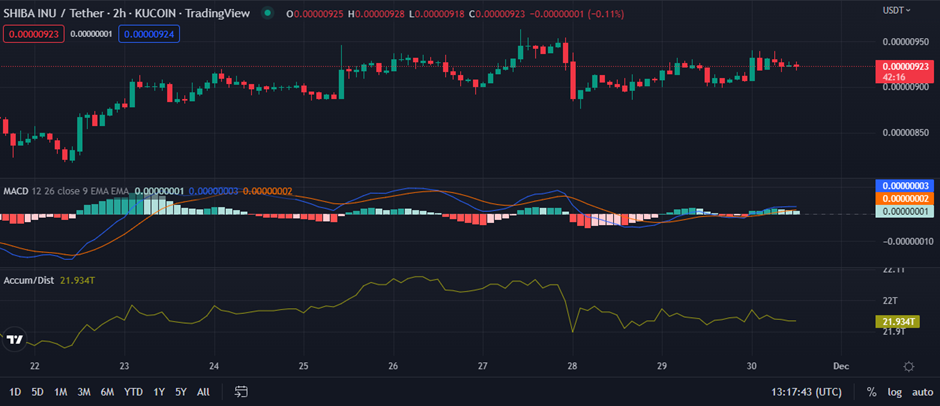
The accumulation distribution (A/D) line, which currently has a reading of 21.93T, is edging lower as the price of Shiba Inu (SHIB) is increasing. The movement of the A/D line indicator suggests that there is an increase in selling pressure and an increase in distribution, which may indicate that a price decline is about to take place.
However, with a reading of 0.00000003, the moving average convergence and divergence (MACD) soars above the signal line, dimming this bear momentum. Traders are concerned that prices will reverse if bulls do not continue to push prices higher given how close the MACD line is to the “0” line.
Shiba Inu (SHIB) appears promising overall and is anticipated to maintain this upward trend so long as market sentiment is still upbeat.
Disclaimer: The views and opinions, as well as all the information shared in this price prediction, are published in good faith. Readers must do their research and due diligence. Any action taken by the reader is strictly at their own risk. Coin Edition and its affiliates will not be held liable for any direct or indirect damage or loss.
Post Views: 13
- Coinsmart. Europe’s Best Bitcoin and Crypto Exchange.Click Here
- Platoblockchain. Web3 Metaverse Intelligence. Knowledge Amplified. Access Here.
- Source: https://coinedition.com/shib-has-potential-for-continued-bull-run-will-the-bulls-rally/

