
Published 13 hours ago
The crypto market witnessed a fresh recovery rally since the beginning of the year 2023. Similar to a majority of altcoins, the Sandbox coin experienced a sustained rally since last week, registering a 22.5% growth. The coin price currently trades at $0.46 and shows further growth potential under the influence falling channel pattern.
advertisement
Key points:
- A falling channel pattern is currently leading to the ongoing downfall in SAND price.
- A bullish breakout from the $0.46 resistance encourages the SAND price to a 15% jump.
- The intraday trading volume in SAND price is $409.6 Million, indicating a 10% loss.
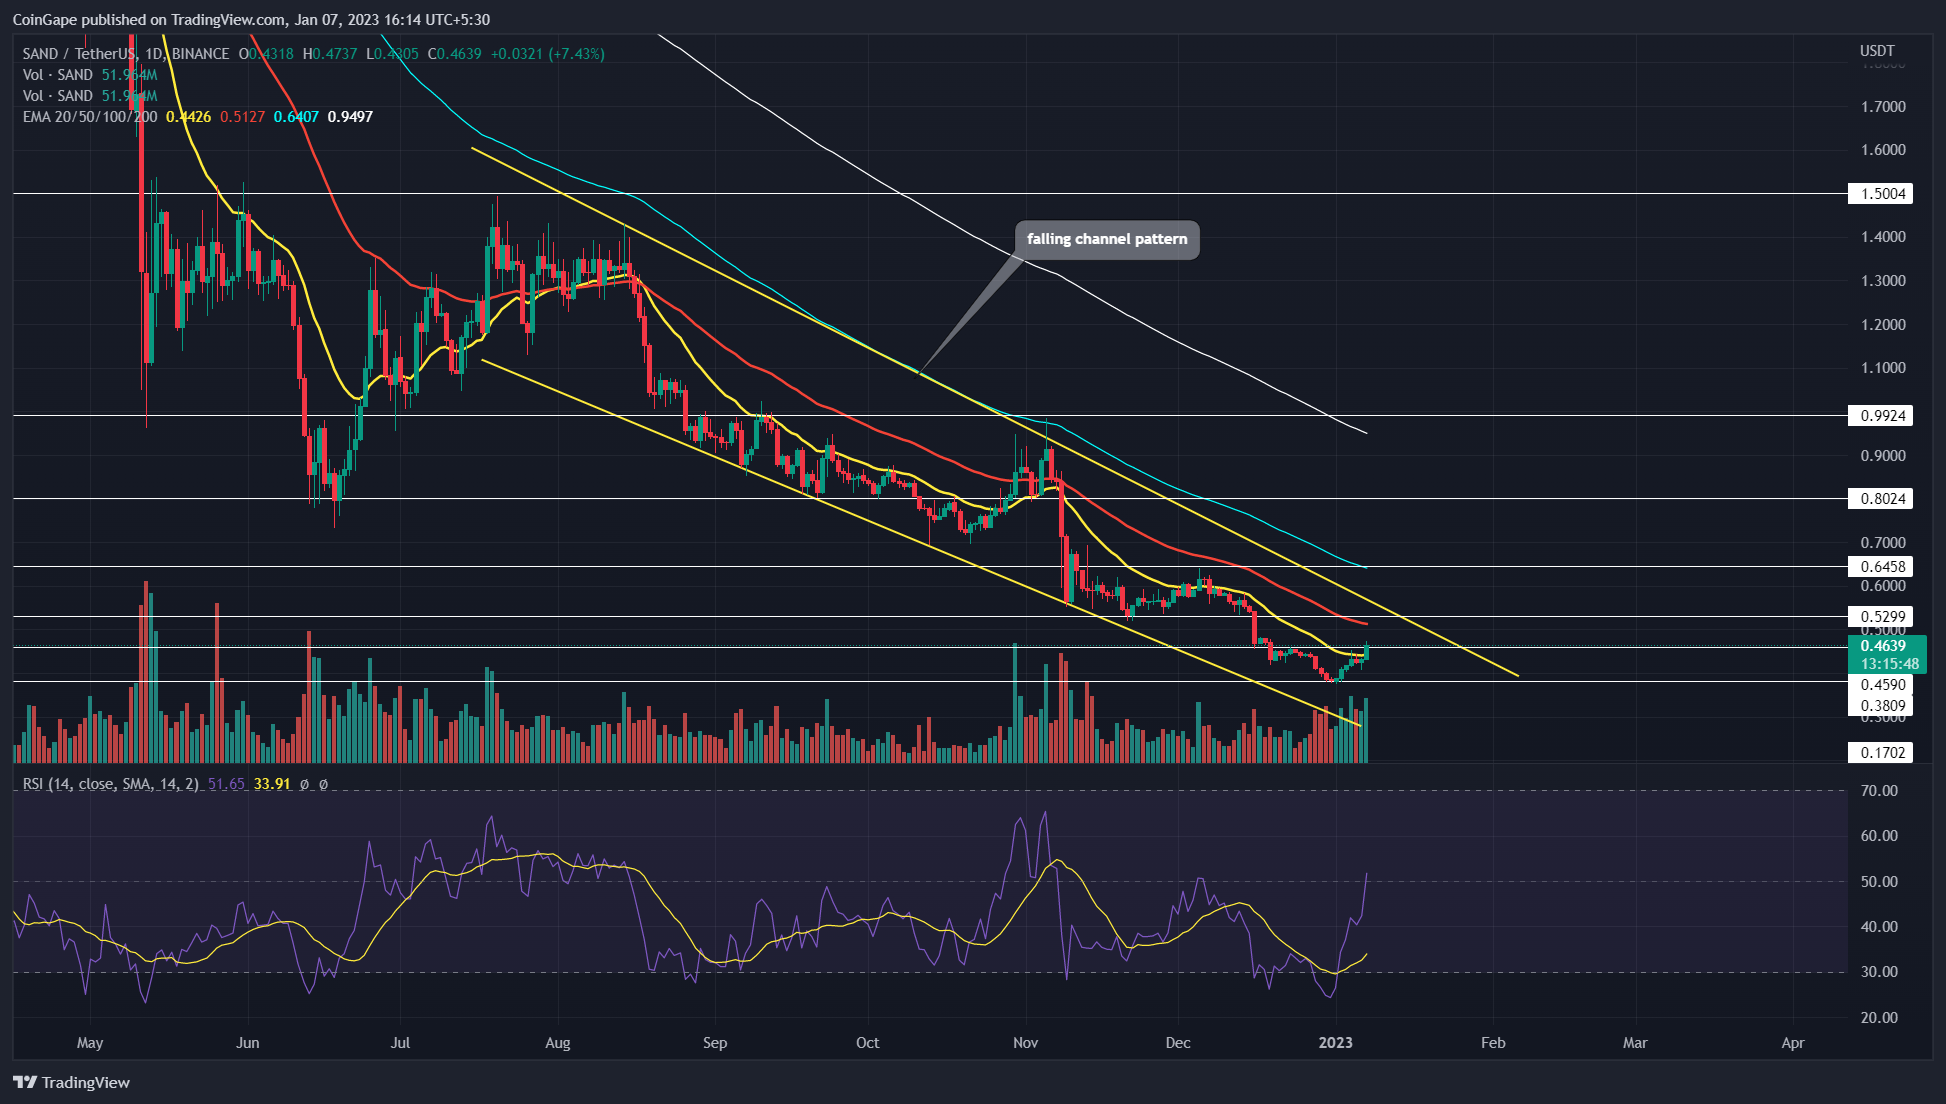
Source- Tradingview
The Sandbox price has shown an established downtrend for the past six months. However, this downfall, led by two parallel walking trendlines, reveals the formation of a falling channel pattern. In theory, even though this pattern leads to a direction downtrend, the prices are encouraged for a massive bullish rally once its breaks the overhead trendline.
Amid the recent recovery in the crypto market, the SAND price showcased a v-shaped recovery from the $0.38 support and surged above a local resistance of $0.46. The long-bullish candle, backed by substantial volume, indicates the commitment of buyers to a bullish recovery.
Trending Stories
Also read: Top Metaverse Tokens To Buy For A Great Start Of 2023
Thus, if the daily candle closes above the $0.46 barrier, the buyers may obtain a suitable launchpad to jump high. With sustained buying, the coin price may rise another 15% to hit the resistance trendline of mentioned channel pattern.
Therefore, for the Sand price to ride a directional bull run, the buyers must breach the resistance trendline. In ideal conditions, this breakout may bolster a bullish price rally to the top swing-high of the pattern, which is $1.5.
Conversely, if the prices show reversal signs at the above trendline, the ongoing downtrend will prolong for a few more trading sessions.
Technical indicator
RSI: The daily RSI slope shows a sharp recovery from an oversold region to a bullish territory indicating the intense buying pressure in the market.
advertisement
EMAs: With the $0.46 resistance breakout, the SAND price also breached the 20-day EMA slope offering an extra edge for coin buyers.
Sandbox Coin Price Intraday Levels
- Spot rate: $0.46
- Trend: Bullish
- Volatility: Low
- Resistance level- $0.53 and $0.64
- Support level- $0.46 and $0.38
Share this article on:
The presented content may include the personal opinion of the author and is subject to market condition. Do your market research before investing in cryptocurrencies. The author or the publication does not hold any responsibility for your personal financial loss.
- SEO Powered Content & PR Distribution. Get Amplified Today.
- Platoblockchain. Web3 Metaverse Intelligence. Knowledge Amplified. Access Here.
- Source: https://coingape.com/markets/sandbox-coin-price-shoot-8-today-is-it-the-beginning-of-a-recovery-rally/

