SNEAK PEEK
- Bears control the Sandbox market as investor confidence declines.
- Selling pressure increases as investors take profits.
- Technical indicators suggest potential for price increase or further decline.
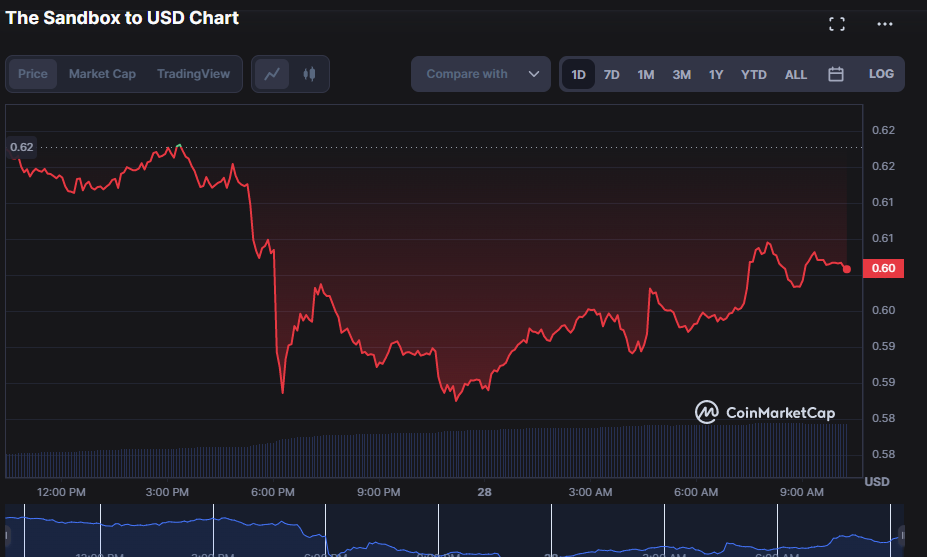
The bears have been in control of the Sandbox market (SAND) over the past 24 hours, driving the price from an intraday high of $0.6187 to an intraday low of $0.5824. This recession shows how the bears have been lowering prices and dictating market behavior lately.
As of the time of press, sustained bearish pressure had caused the price to drop from 2.38% to $0.6028. Investors who benefited greatly from the increase in price are making huge profits off the table, as shown by the rise in selling pressure in SAND.
Market capitalization decreased by 2.41% during the recession, falling to $903,546,807, while 24-hour trading volume increased by 123.85%, reaching $152,199,378. Due to the economic downturn, investor confidence has declined, which is what has caused the market capitalization to decline. On the other hand, the increase in trading volume could be the result of investors taking advantage of the recession’s lower stock prices.
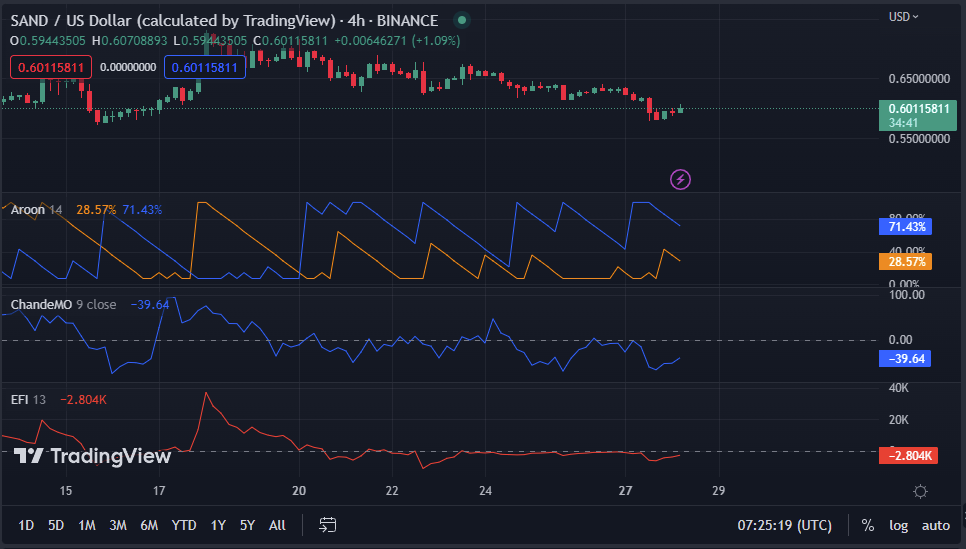
The Elder Force Index (EFI) is negative on the Sandbox market’s 4-hour price chart with a value of -2.868. This shows that there is more selling pressure than buying pressure in the market, which may herald the beginning of a bearish trend soon. Despite the fact that the cost of SAND has decreased, a sizable price increase could be on the horizon.
The Chande Momentum Oscillator (ChandeMO) is negative and has a value of -40.02 on the 4-hour price chart. This suggests that the asset’s price has been falling rapidly in the short term, and it might keep falling until it reaches the ChandeMO oversold levels or exhibits signs of a bullish reversal.
On the 4-hour price chart, the lines for the Aroon up and down readings of 71.43% and 28.57% point south. In the short term, this implies that the price might very well continue to trend downward, but additional research is required to confirm this. Trading activity suggests that traders are hedging their positions ahead of a potential market decline.
The Chaikin Money Flow (CMF) is negative with a value of -0.02 and a line that faces south. This shows that there is a slight difference between the buying and selling pressure in the market, but it is not a strong bearish signal on its own and should be examined in conjunction with other technical indicators.
The Sandbox market’s 4-hour price chart’s Cumulative Volume Index (CVI) value of 385.6098 shows a sharp increase in trading volume over the previous 4 hours, which may point to a change in market viewpoint and potential price movement.
SAND bears dominate as prices fall, but high trading volume suggests a potential rebound. This move suggests that traders should keep an eye on technical indicators for signals of a trend reversal.
Disclaimer: Cryptocurrency price is highly speculative and volatile and should not be considered financial advice. Past and current performance is not indicative of future results. Always research and consult with a financial advisor before making investment decisions.
- SEO Powered Content & PR Distribution. Get Amplified Today.
- Platoblockchain. Web3 Metaverse Intelligence. Knowledge Amplified. Access Here.
- Source: https://investorbites.com/sand-price-analysis-28-3/

