- Ripple price started a fresh decline from the $0.400 zone against the US dollar.
- The price is now trading above $0.3700 and the 55 simple moving average (4-hours).
- There is a key bullish trend line forming with support near $0.3780 on the 4-hours chart of the XRP/USD pair (data source from Bittrex).
- The pair could extend losses if it stays below the $0.400 resistance zone.
Ripple price is struggling below $0.400 against the US Dollar, similar to bitcoin. XRP price must stay above $0.3720 to avoid more downsides in the near term.
Ripple Price Analysis
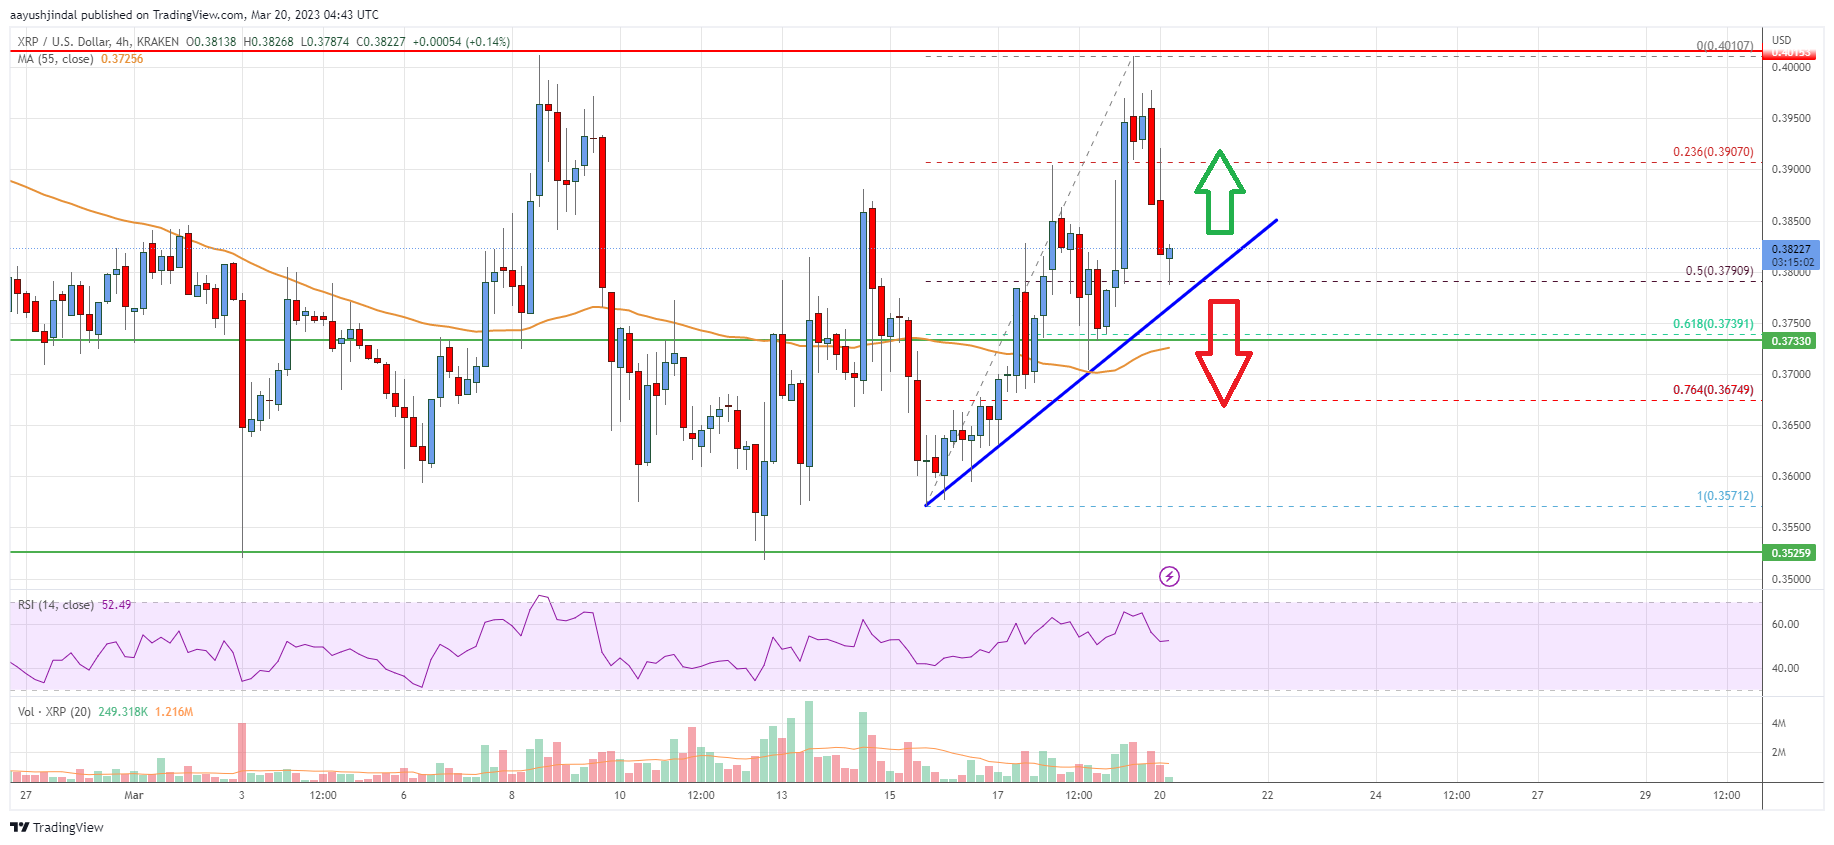
This past week, ripple price attempted an upside break above the $0.4000 zone against the US Dollar. The XRP/USD pair failed to gain bullish momentum and formed a high near $0.4010.
The price declined below the $0.3950 support zone to move into a bearish zone. There was a move below the 23.6% Fib retracement level of the upward move from the $0.3571 swing low to $0.4010 high. However, it is still trading above $0.3700 and the 55 simple moving average (4-hours).
There is also a key bullish trend line forming with support near $0.3780 on the 4-hours chart of the XRP/USD pair. The trend line is near the 50% Fib retracement level of the upward move from the $0.3571 swing low to $0.4010 high.
On the upside, the price is facing resistance near $0.3850. The next major resistance is near the $0.3950 level. The main resistance is near the $0.4000 zone.
A clear move above the $0.3950 and $0.4000 resistance zones might start a fresh increase. In the stated case, the price could even surpass the $0.4120 resistance. Any more gains might send the price towards the $0.432 resistance.
An initial support on the downside is near the $0.3780. The next major support is near the $0.3720 level. Any more losses could lead the price towards the $0.3580 level, below which the price might even test $0.3500.
Ripple Price
Looking at the chart, ripple price is now trading above the $0.3750 zone and the 55 simple moving average (4-hours). Overall, the price could extend losses if it stays below the $0.400 resistance zone.
Technical indicators
4 hours MACD – The MACD for XRP/USD is now gaining momentum in the bearish zone.
4 hours RSI (Relative Strength Index) – The RSI for XRP/USD is above the 50 level.
Key Support Levels – $0.3780, $0.3720 and $0.3570.
Key Resistance Levels – $0.3950 and $0.4000.
- SEO Powered Content & PR Distribution. Get Amplified Today.
- Platoblockchain. Web3 Metaverse Intelligence. Knowledge Amplified. Access Here.
- Source: https://www.livebitcoinnews.com/ripple-price-analysis-bears-keep-protecting-0-40/

