BlackRock’s application for a spot Bitcoin exchange-traded fund (ETF) has encouraged other financial firms to follow suit. First, it was the New York-based asset management fund WisdomTree, which made a new filing on June 21 for a Bitcoin (BTC) ETF. This was then followed by investment manager Invesco, which reactivated its application for a spot ETF.
These announcements boosted investor sentiment, resulting in a short squeeze and additional buying interest from traders who may have been waiting on the sidelines. The slew of events over the past few days has increased buying interest in Bitcoin, which sent its market dominance to above 50% on June 19.
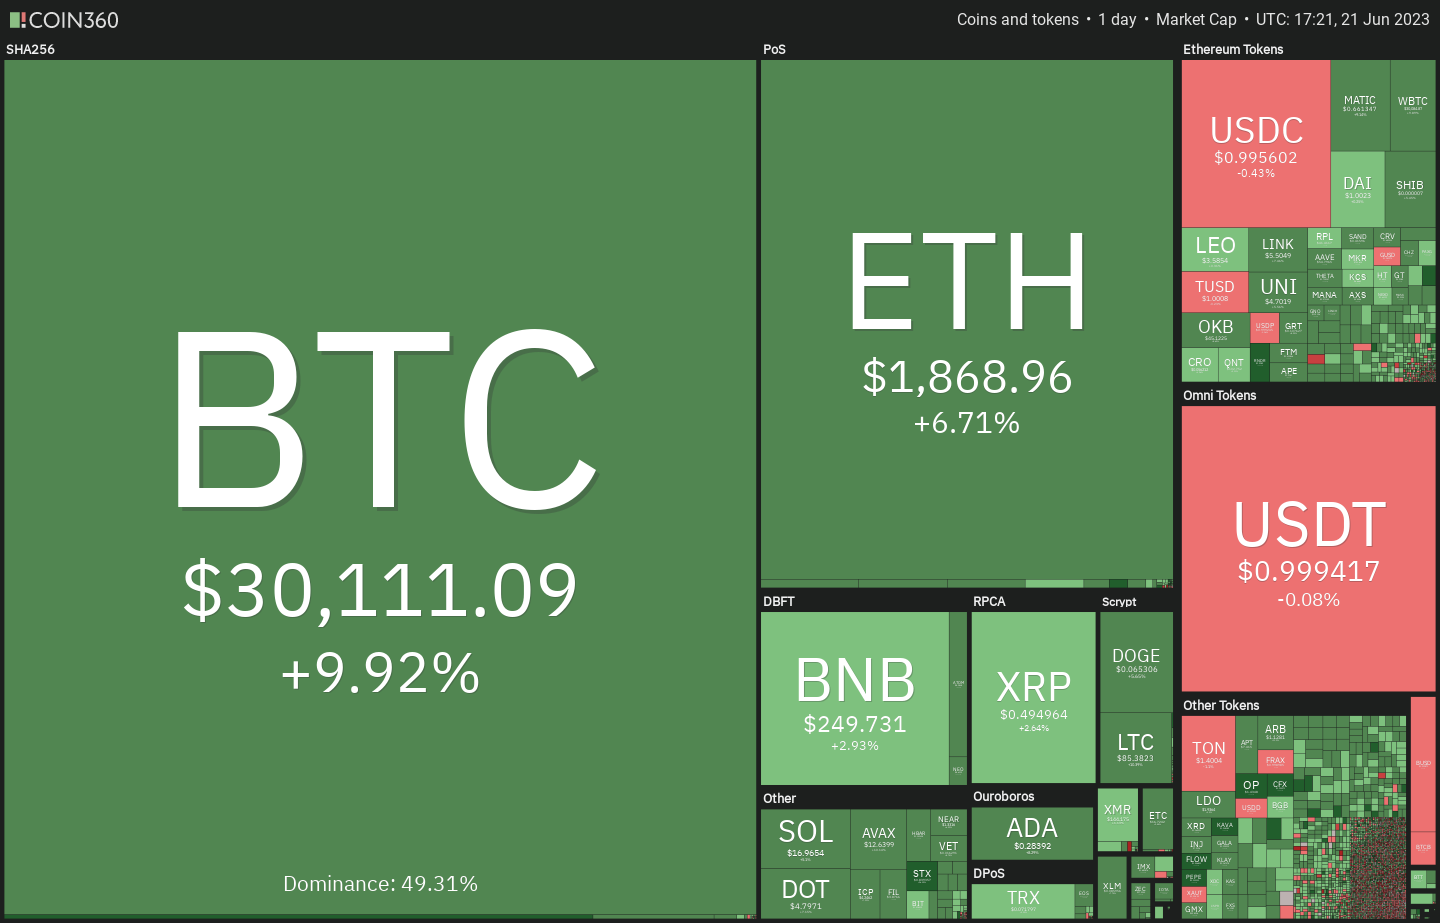
The short-term traders who are expecting a quick rally to the all-time highs may be in for a shock. In the latest edition of its weekly newsletter, “The Week On-Chain,” analytics firm Glassnode warned investors that their patience could be tested for another eight to 18 months before the market hits a new all-time high.
Will Bitcoin’s rally continue to rise for a few more days, or is it time to book profits? Let’s study the charts of the top 10 cryptocurrencies to find out.
Bitcoin price analysis
Bitcoin broke and closed above the 20-day exponential moving average (EMA) of $26,934 on June 17. The bears tried to sink the price back below the level on June 18, but the bulls held their ground.

That attracted aggressive buying on June 19, which picked up further momentum on June 20. That catapulted the price above the resistance line of the descending channel pattern, signaling a short-term trend change. This move may have hit the stops of several short-term bears, resulting in a short squeeze. That sent the price skyrocketing to $30,800 on June 21.
The bears are unlikely to give up easily. They will try to halt the rally at $31,000, but if the bulls do not give up much ground from the current level, it will enhance the prospects of a rally above the overhead resistance. If that happens, the BTC/USDT pair may surge to $32,400. The bears are expected to defend this level with all their might because if they fail to do that, the pair may surge to $40,000.
If bears want to trap the bulls, they will have to yank the price back below the moving averages. That could result in a long liquidation and threaten the $25,250 support.
Ether price analysis
Ether (ETH) turned up from the strong support of $1,700 on June 19, signaling strong buying at this level.

The bulls continued their purchases and pushed the price above the 20-day EMA ($1,781) on June 20. This was the first sign that the bears were losing their grip. The bullish momentum picked up further on June 21 and sent the ETH/USDT pair above the downtrend line. The pair is expected to rally to the psychological resistance at $2,000.
Contrarily, if the price reverses direction from the current level and slips below the 20-day EMA, it will suggest that bears remain in control. The pair could then dip to $1,700.
BNB price analysis
The wick on BNB’s (BNB) June 21 candlestick shows that the bears are selling the relief rallies to the 20-day EMA ($257).
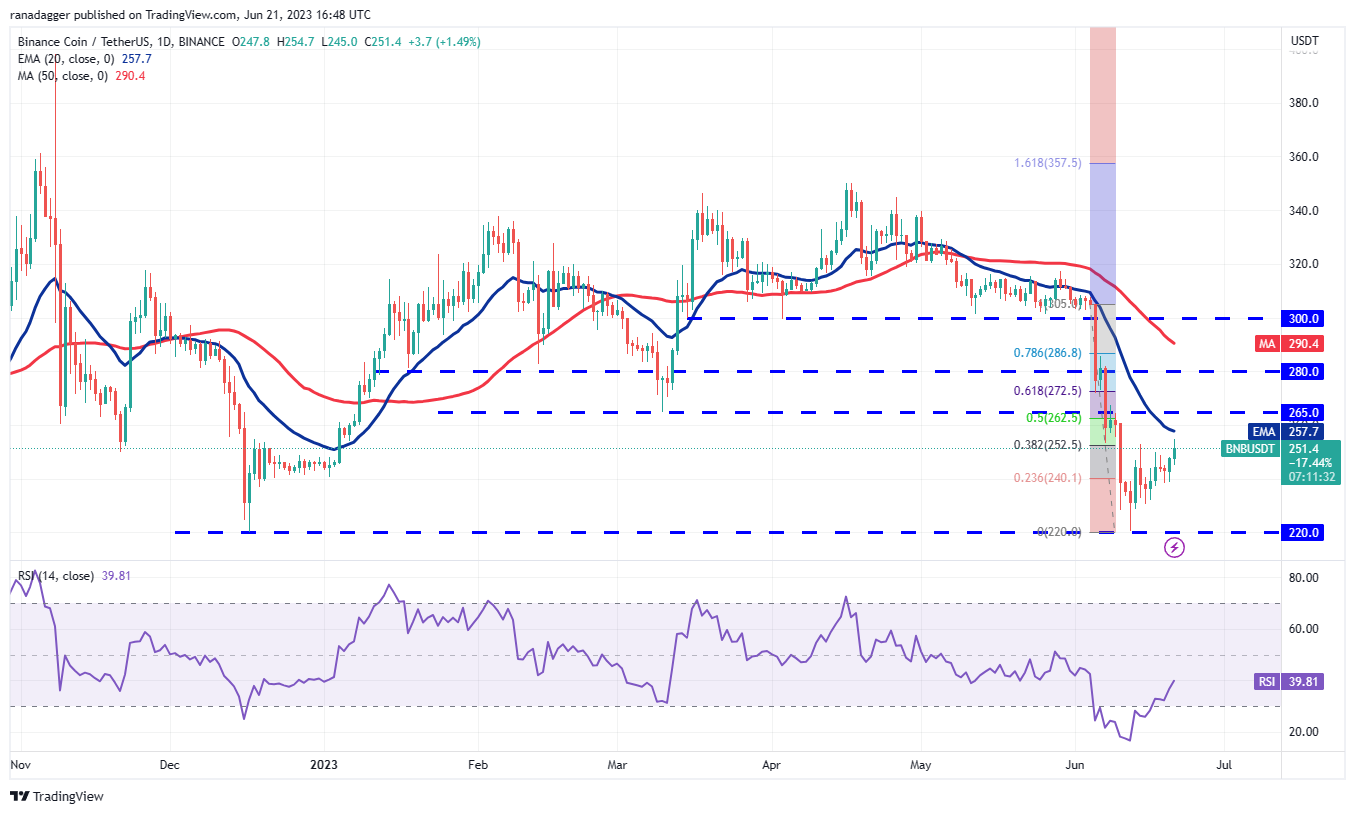
The downsloping moving averages and the relative strength index (RSI) in the negative territory indicate that bears have an edge. If the price turns down from the current level, the BNB/USDT pair may slide to $230 and later retest the vital support at $220.
On the contrary, if bulls overcome the obstacle at the 20-day EMA, it will suggest solid demand at lower levels. The pair could then attempt a rally to the 61.8% Fibonacci retracement level of $272 and subsequently to the 50-day simple moving average (SMA) of $290.
XRP price analysis
XRP (XRP) turned down sharply from the 20-day EMA ($0.49) on June 20 and slipped below the 50-day SMA ($0.47), but the long tail on the candlestick shows aggressive buying at lower levels.
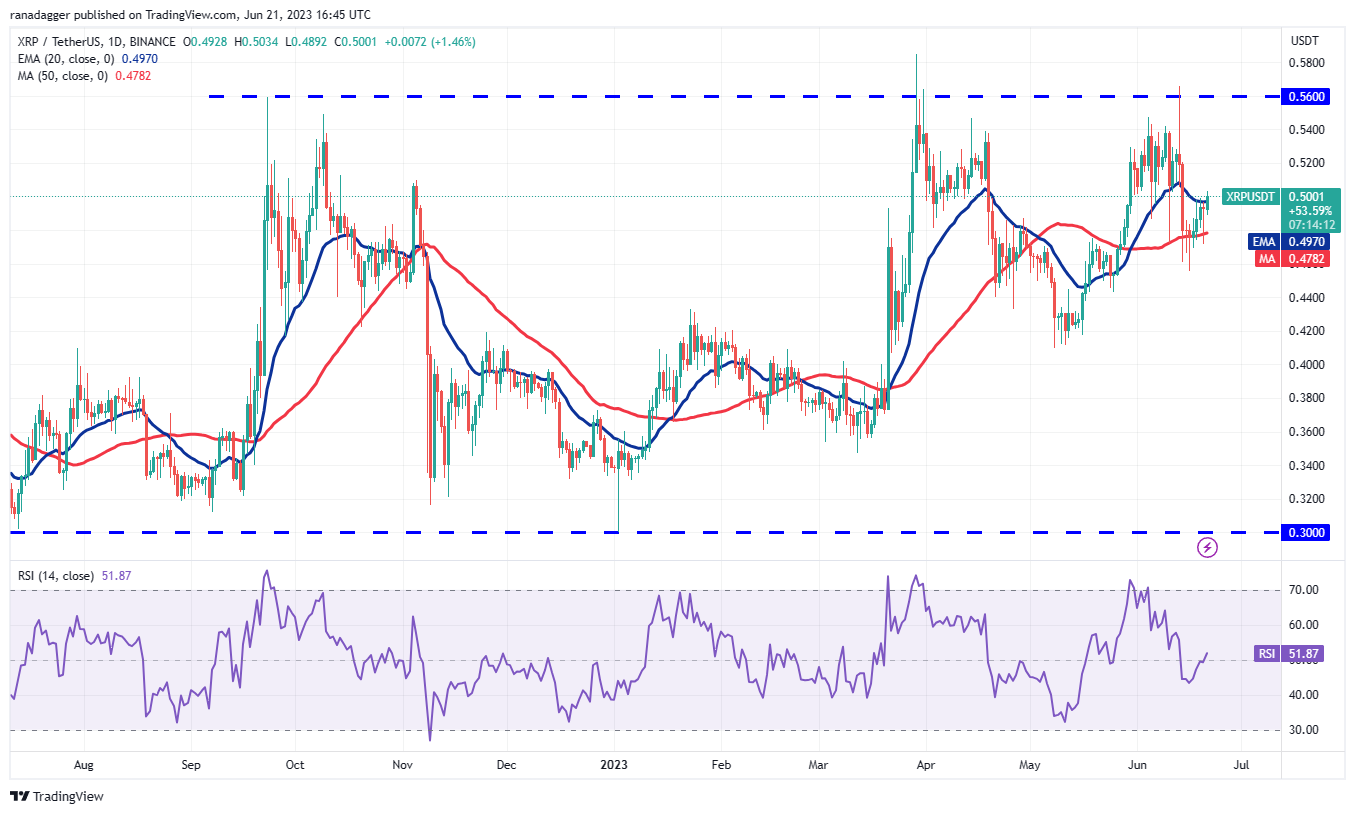
The 20-day EMA has flattened out and the RSI is just above the midpoint, indicating a balance between supply and demand. If bulls sustain the price above the 20-day EMA, it could open the doors for a potential rally to the overhead resistance at $0.56. This level may again act as a strong barrier.
The 50-day SMA remains the key support to watch out for on the downside. If this level is breached, the advantage will tilt in favor of the bears. The XRP/USDT pair could then plummet to $0.41.
Cardano price analysis
The long tail on Cardano’s (ADA) June 20 candlestick shows that the bulls are trying to guard the zone between $0.25 and $0.24.

The ADA/USDT pair could reach the $0.30 level, which is likely to behave as a formidable resistance. If the price turns down sharply from this level, the pair may consolidate between $0.30 and $0.24 for a while.
Contrary to this assumption, if bulls kick the price above $0.30, it will suggest the start of a sustained recovery to the 50-day SMA ($0.34). The support on the downside is at $0.25 and then at $0.22.
Dogecoin price analysis
Dogecoin (DOGE) bounced off the strong support at $0.06 on June 20, indicating that the bulls are fiercely defending this level.

The DOGE/USDT pair has risen above the 20-day EMA ($0.06), suggesting that the bears may be losing their grip. The pair may next rally to $0.07. If the price turns down sharply from this level, it will signal that the pair may stay range-bound between $0.06 and $0.07 for some more time.
Buyers will have to clear the hurdle at $0.07 to indicate strength. The pair may then climb to $0.08, where the bears may again mount a strong defense. On the downside, a tumble below $0.06 will indicate an advantage to bears.
Solana price analysis
Solana (SOL) rose above the immediate resistance of $16.18 on June 20 and reached the 20-day EMA ($17.04) on June 21.

If the price turns down from the current level and slips below $16.18, it will suggest that bears are active at higher levels. The SOL/USDT pair may then again retest the critical support zone between $15.28 and $14.06.
Alternatively, if bulls drive the price above the 20-day EMA, it will suggest that the break below $15.28 may have been a bear trap. That could cause a short squeeze, propelling the pair to the 50-day SMA ($19.34).
Related: 3 reasons why Ethereum’s market cap dominance is on the rise
Polygon price analysis
Polygon (MATIC) is gradually rising toward the breakdown level of $0.69. The 20-day EMA ($0.69) is also placed at this level; hence, the bears are expected to defend this resistance with vigor.

The downsloping moving averages and the RSI in the negative territory indicate a minor advantage to the bears. If the price turns down from $0.69, the MATIC/USDT pair could remain stuck between $0.69 and $0.50 for a few days.
The first sign of strength will be a break and close above the 20-day EMA. Such a move will suggest strong buying at lower levels. The pair may then rise to the 50-day SMA ($0.82). The crucial support to watch for on the downside is $0.50.
Litecoin price analysis
Litecoin (LTC) rebounded sharply off the strong support at $75 on June 20, indicating that the bulls are aggressively buying the dips to this level.

The buying continued on June 21, and the bulls propelled the price above the 20-day EMA ($81), signaling a comeback. There is a minor resistance at the 50-day SMA ($85), but it is likely to be crossed. The LTC/USDT pair may first hit $92 and then $98.
Time is running out for the bears. If they want to reestablish control, they will have to quickly tug the price back below the $75 to $71 support zone. Until that happens, the bulls are likely to view the dips as a buying opportunity.
Polkadot price analysis
The bears tried to pull Polkadot (DOT) toward the $4.22 support on June 20, but the long tail on the day’s candlestick shows strong buying at lower levels.

Buyers have pushed the price to the 20-day EMA ($4.76), which is likely to act as a strong resistance. If bulls drive the price above the 20-day EMA, the DOT/USDT pair could reach the breakdown level of $5.15.
This level is again likely to pose a strong challenge to the bulls. If the price turns down from this level, the pair may oscillate between $5.15 and $4.22 for some time. The bears will have to yank the price below $4.22 to start the next leg of the downtrend.
This article does not contain investment advice or recommendations. Every investment and trading move involves risk, and readers should conduct their own research when making a decision.
This article is for general information purposes and is not intended to be and should not be taken as legal or investment advice. The views, thoughts, and opinions expressed here are the author’s alone and do not necessarily reflect or represent the views and opinions of Cointelegraph.
- SEO Powered Content & PR Distribution. Get Amplified Today.
- EVM Finance. Unified Interface for Decentralized Finance. Access Here.
- Quantum Media Group. IR/PR Amplified. Access Here.
- PlatoAiStream. Web3 Data Intelligence. Knowledge Amplified. Access Here.
- Source: https://cointelegraph.com/news/price-analysis-6-21-btc-eth-bnb-xrp-ada-doge-sol-matic-ltc-dot

