SNEAK PEEK
- The MATIC market experiences bearish pressure with the potential for price reversal.
- Caution and uncertainty lead to decreased MATIC investments.
- The Elder Force Index and Chande Momentum Oscillator indicate a potential for a bullish reversal.
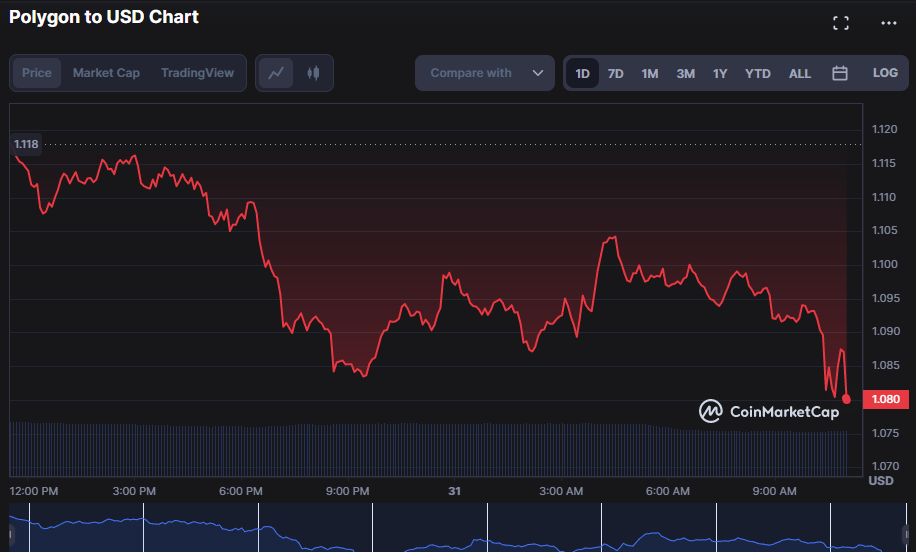
Over the past 24 hours, the bears have been in charge of the Polygon market (MATIC), driving the price from an intraday high of $1.12 to an intraday low of $1.08. This downturn is evidence that the bears have recently been in charge of the market, bringing down prices.
As of press time, the price had dropped from 2.94% to $1.09 due to ongoing bearish pressure. Investors who stand to benefit from the rise in prices but are cashing out on their gains due to this decline are to blame for the increased selling pressure in MATIC.
The market capitalization fell by 2.95% to $9,878,156,606, and the 24-hour trading volume fell by 18.25% to $315,605,840 due to the recession. Investors’ caution and lack of certainty as they carefully watch the Polygon market and hold off on making sizable investments until they see a recovery is to blame for this decline.
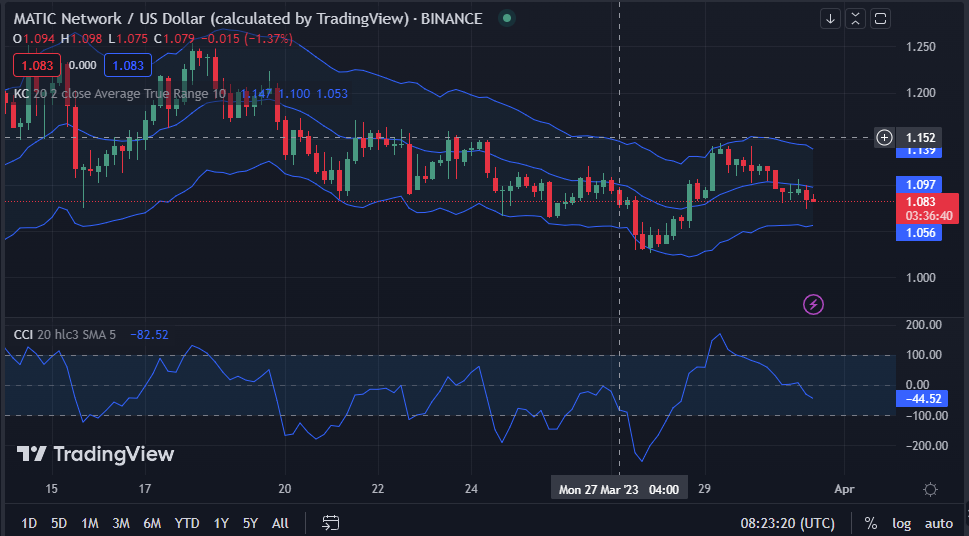
The Commodity Channel Index (CCI), which has a value of -37.31 on the Polygon market’s 4-hour price chart, is negative. This movement indicates significant selling pressure on the market and that a price reversal will likely happen soon. Even though the cost of MATIC has dropped, a price increase could be on the horizon.
On the Kelter Channels (KC), the bands have upper and lower band values of 1.139 and 1.057, respectively. This movement suggests that the market is in a significant downtrend. If the price movement pierces the bottom band, it may indicate continued downward momentum and present opportunities for profit-taking or short-selling.
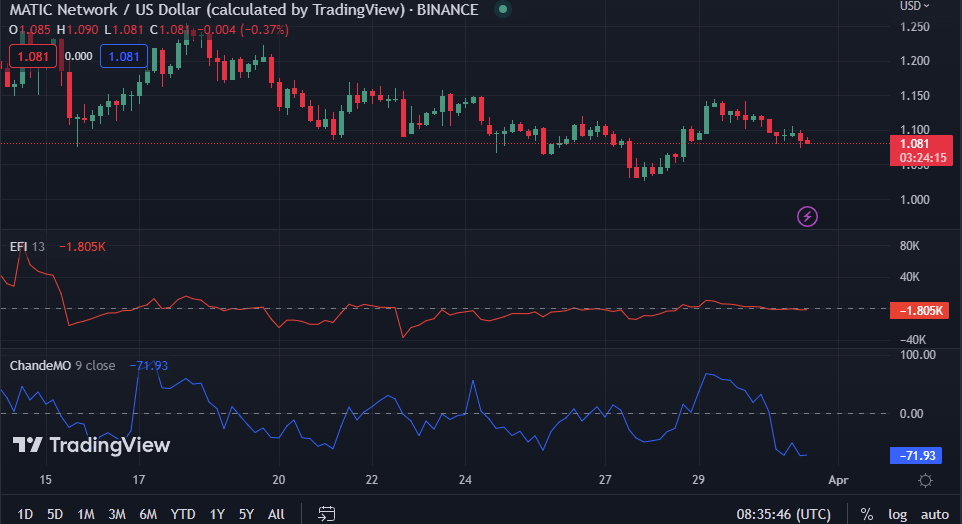
On the Polygon market’s 4-hour price chart, the Elder Force Index (EFI) is negative with a value of -1.767k, implying that there is more selling pressure in the market, which may signal the impending start of a bearish trend. Even though the price of MATIC has dropped, a significant price increase could be coming soon.
On the 4-hour price chart, the Chande Momentum Oscillator (ChandeMO) has a value of -70.91 hence negative. This move indicates that the asset’s price has recently been falling quickly, and it may continue to do so until it reaches the ChandeMO oversold levels or shows signs of a bullish reversal.
MATIC faces bearish pressure, but a potential price reversal is on the horizon. Caution is advised, but there may be opportunities for profit-taking or short-selling.
Disclaimer: Cryptocurrency price is highly speculative and volatile and should not be considered financial advice. Past and current performance is not indicative of future results. Always research and consult with a financial advisor before making investment decisions
- SEO Powered Content & PR Distribution. Get Amplified Today.
- Platoblockchain. Web3 Metaverse Intelligence. Knowledge Amplified. Access Here.
- Source: https://investorbites.com/polygon-matic-price-analysis-31-3/

