Join Our Telegram channel to stay up to date on breaking news coverage
The Polkadot price prediction shows that DOT is likely to make another attempt at breaking out above the $5.50 resistance level.
Polkadot Prediction Statistics Data:
- Polkadot price now – $5.46
- Polkadot market cap – $6.9 billion
- Polkadot circulating supply – 168.3 million
- Polkadot total supply – 1.2 million
- Polkadot CoinMarketCap ranking – #15
DOT/USD Market
Key Levels:
Resistance levels: $6.50, $7.00, $7.50
Support levels: $4.50, $4.00, $3.50
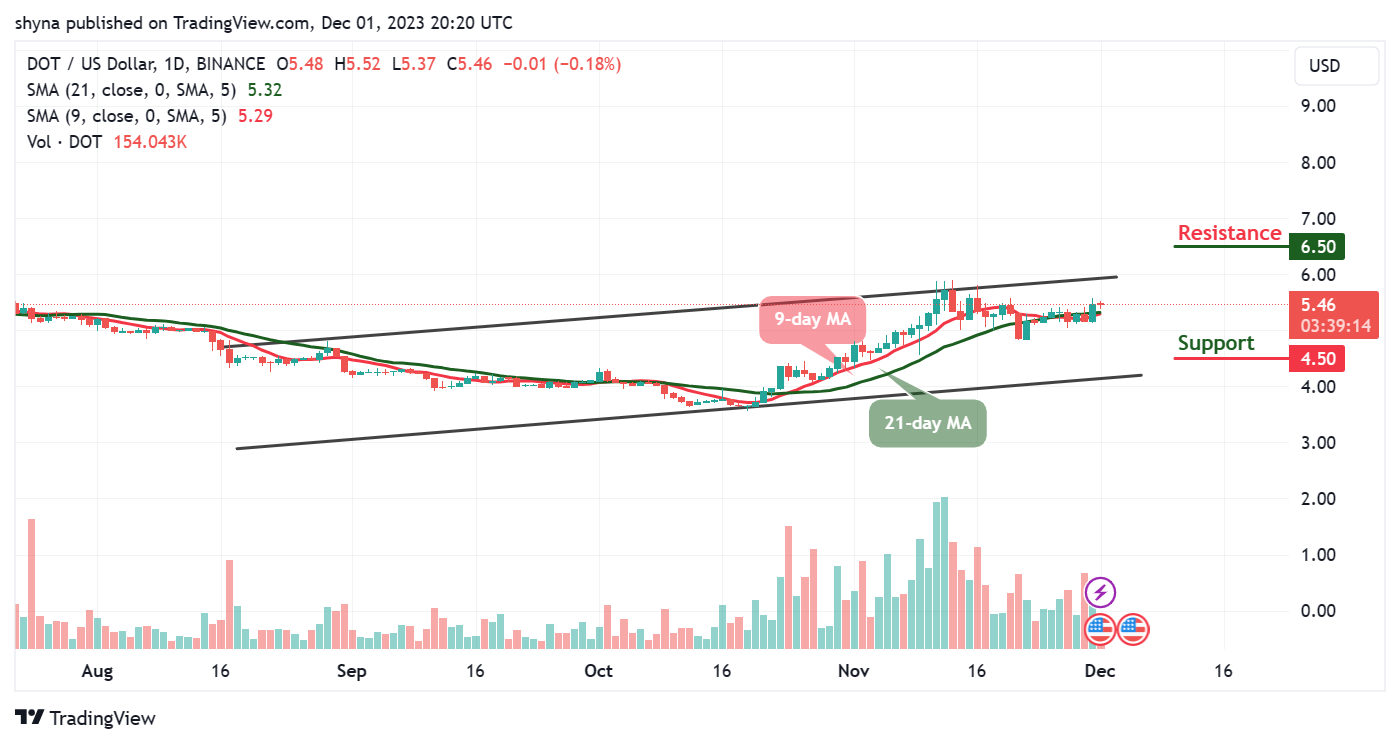
DOT/USD bulls were rejected around the $5.52 level as the coin relapsed to the downside. However, the Polkadot price is heading toward the 9-day and 21-day moving averages and it’s likely to bring the coin below the support level of $5.00 if the bears resume back into the market.
Polkadot Price Prediction: DOT Price May Follow the Uptrend
The Polkadot price is changing hands at $5.46 where it could face up. If the DOT/USD breaks above the upper boundary of the channel, the coin may continue its upward movement to retest the previous high of $6.00. Therefore, the nearest resistance levels are located at $6.50, $7.00, and $7.50. On the contrary, if the coin heads toward the lower boundary of the channel, it could hit the support levels at $4.50, $4.00, and $3.50 respectively giving a fade bullish trading volume.
DOT/BTC Consolidates Within the Moving Averages
Against Bitcoin, the Polkadot price is following the bearish movement as the coin prepares below the 9-day moving average. On the downside, if the market price heads to the downside, the next support level may come at 1300 SAT, and then locate further key support at 1200 SAT and below if the sell-off later becomes huge.
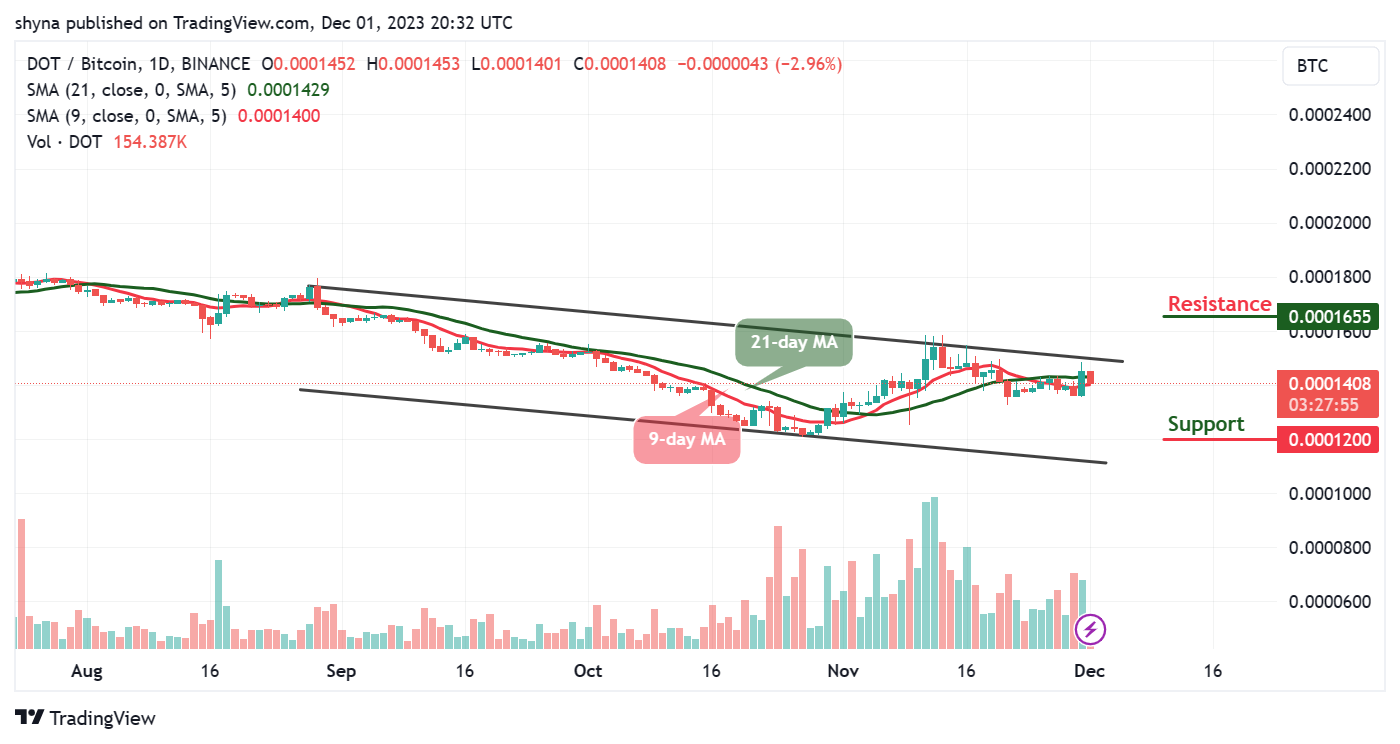
However, on the upside, if the bulls push the price back above the resistance level of 1453 SAT; Polkadot could face the 1500 SAT. Any other resistance level lies at 1655 SAT and above. Meanwhile, the 9-day moving average remains below the 21-day moving average, which could confirm the bearish movement on the market. Nonetheless, if it moves below the support level of 1250 SAT, it may bring more bearish pressure into the market.
Polkadot Alternatives
As the daily chart reveals, the Polkadot price is likely to face the south but if the buyers can hold the current market value and the coin begins to climb higher, bulls may expect immediate resistance to be located at $6.0, which is above the upper boundary of the channel. Meanwhile, if the bears continue to push the market further lower, immediate support below the $5.0 level may be located.
Nevertheless, Polkadot (DOT), with a $6.9 billion market cap, faces challenges for quick gains due to its size. In contrast, Bitcoin Minetrix, with a lower market cap, has significant growth potential, especially in mining. However, the token is positioned strategically to align with market trends and Bitcoin protocol fundamentals, having raised over $4.6 million in its ongoing presale, showcasing strong support and growth prospects.
New Crypto Mining Platform – Bitcoin Minetrix

- Audited By Coinsult
- Decentralized, Secure Cloud Mining
- Earn Free Bitcoin Daily
- Native Token On Presale Now – BTCMTX
- Staking Rewards – Over 100% APY
Join Our Telegram channel to stay up to date on breaking news coverage
- SEO Powered Content & PR Distribution. Get Amplified Today.
- PlatoData.Network Vertical Generative Ai. Empower Yourself. Access Here.
- PlatoAiStream. Web3 Intelligence. Knowledge Amplified. Access Here.
- PlatoESG. Carbon, CleanTech, Energy, Environment, Solar, Waste Management. Access Here.
- PlatoHealth. Biotech and Clinical Trials Intelligence. Access Here.
- Source: https://insidebitcoins.com/news/polkadot-price-prediction-for-today-december-1-dot-technical-analysis

