SNEAK PEEK
- Whale’s massive PEPE purchase shows unwavering confidence.
- The bullish trend persists for PEPE despite a short-term trading decrease.
- Technical indicators signal an increase in bullish momentum for PEPE.
This recent purchase by the whale of 227B PEPE at $0.0000011 again shows their confidence in the token’s potential. The fact that they spent a total of 3.25 million USD to acquire 2.81 trillion PEPE demonstrates their significant investment in this cryptocurrency. This whale is no stranger to the crypto world, as on-chain data reveals that they have made a profit of approximately $11.47 million on PEPE in the past.
Whale”0x31f5″ spend 250K $USDC to buy 227B $PEPE at $0.0000011 again 2 hrs ago.
The whale spent a total of 3.25M $USDC to buy 2.81T $PEPE.
The on-chain data shows that this whale is the SmartMoney who made ~$11.47M on $PEPE before!
1.🧵
A threadhttps://t.co/C5x7OcktWH pic.twitter.com/G9krOMH2iE
— Lookonchain (@lookonchain) June 9, 2023
With such a successful track record, it’s no wonder that this SmartMoney investor continues to believe in the future of PEPE and its potential for growth in the crypto market. Over the past 24 hours, bulls have dominated the PEPE market, driving prices from an intraday low of $0.000001043 to an intraday high of $0.000001125. Due to the ongoing bullish trend, the price had increased by 3.11% to $0.000001092 as of press time.
PEPE’s market capitalization increased by 3.11% to $427,191,371, while the 24-hour trading volume decreased by 27.52 to $108,632,812, respectively. This move suggests that investors are still upbeat on PEPE’s long-term prospects despite the decrease in short-term trading activity.
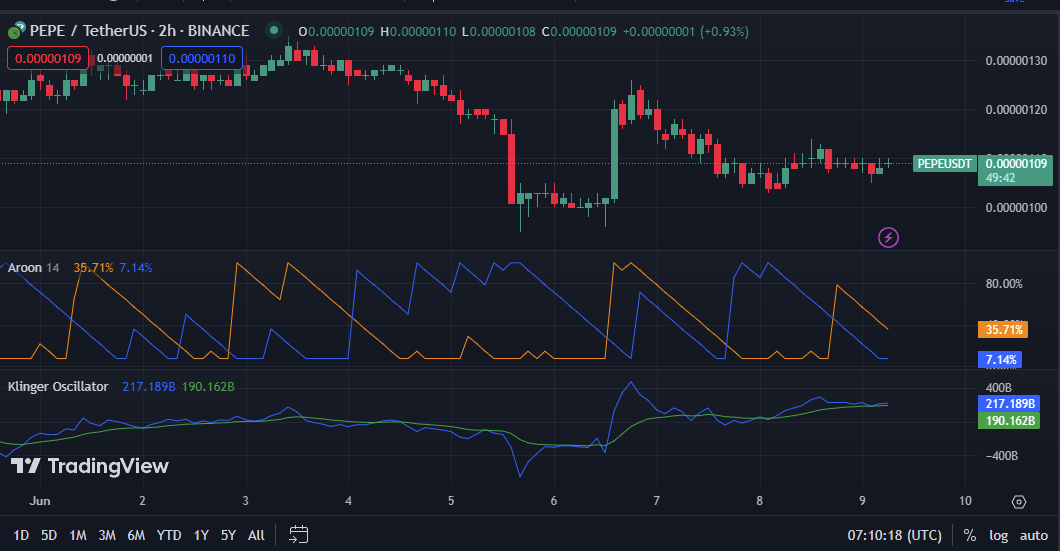
The values for the Aroon up and down are 35.71% and 7.14%, respectively, on the 2-hour price chart for PEPE. This move demonstrates that the trend is strong and may continue for some time, despite the possibility of brief reversals or corrections, allowing traders to pinpoint potential entry and exit points for trades.
The Klinger Oscillator, which has a reading of 217.618 and is moving above its signal line, shows that bullish momentum is increasing in the market. Investors may view a crossing of the Klinger oscillator’s line below the signal line as a sell signal and consider liquidating existing long positions or opening new ones.
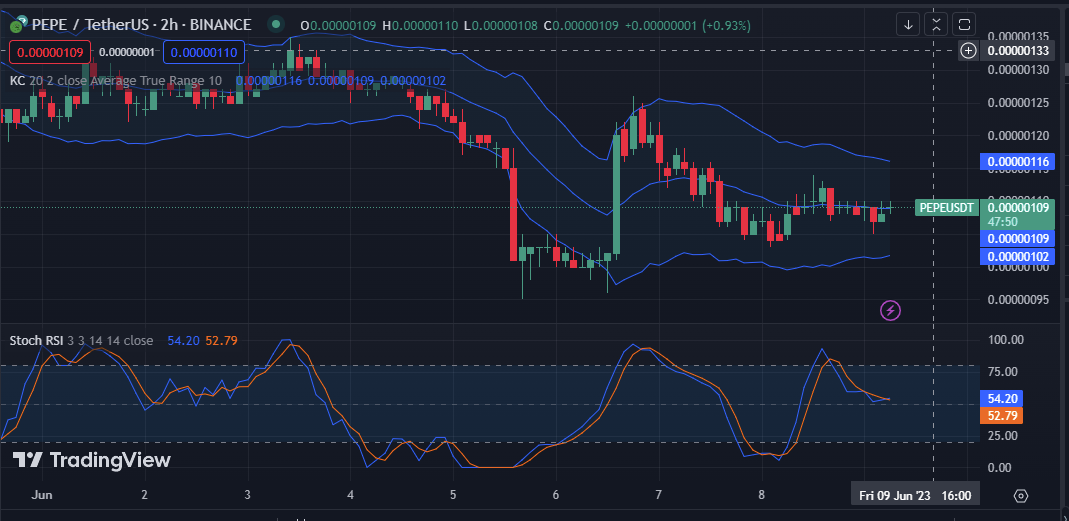
On PEPE’s 2-hour price chart, the Keltner Channel bands’ upper and lower readings are 0.00000116 and 0.00000109, respectively, indicating a bullish trend. With a sell target price close to the upper Keltner Channel, traders may want to consider purchasing PEPE at the current levels.
The bullish momentum is backed as green candlesticks form on the PEPE price chart, and price action moves on the middle band. However, traders should know potential resistance levels and use a stop loss to minimize risk if the bull’s strength wanes.
The stochastic RSI value of 54.20 on the 2-hour price chart for PEPE, and movement above its signal line show bullish momentum in the market. This motion implies that buyers are in charge of the market and that further price increases for PEPE are possible.
In conclusion, PEPE’s bullish momentum persists with a whale’s unwavering confidence. Technical indicators support further growth, signaling a promising future.
Disclaimer: Cryptocurrency price is highly speculative and volatile and should not be considered financial advice. Past and current performance is not indicative of future results. Always research and consult with a financial advisor before making investment decisions.
- SEO Powered Content & PR Distribution. Get Amplified Today.
- EVM Finance. Unified Interface for Decentralized Finance. Access Here.
- Quantum Media Group. IR/PR Amplified. Access Here.
- PlatoAiStream. Web3 Data Intelligence. Knowledge Amplified. Access Here.
- Source: https://investorbites.com/pepe-price-analysis-09-06/

