SNEAK PEEK
- PEPE’s Binance debut skyrockets prices to an all-time high.
- Giant Whale makes $14.5M profit trading PEPE.
- PEPE’s bullish trend shows potential for further growth.
PEPE’s debut on Binance on May 5th saw the Memecoin reach an all-time high of $0.000004354 despite commencing trade at $0.000001977 in the previous 24 hours.
A day after the listing, a gigantic whale who acquired 4.23T $PEPE ($15.6M) using 422 $ETH ($871K) and 200K $USDC transferred all $PEPE to Binance at an average purchasing cost of $0.0000002535 and earned a profit of $14.5M.
This giant whale who bought 4.23T $PEPE ($15.6M) with 422 $ETH ($871K) and 200K $USDC deposited all $PEPE to #Binance 30 mins ago.
His average buying cost is $0.0000002535, and the profit is ~$14.5M now!
He may sell after opening trading, watching out for the price change.⚠️ pic.twitter.com/7UoNYG9PJb
— Lookonchain (@lookonchain) May 5, 2023
During the bull run, Pepe’s market capitalization increased to $1,093,795,056, while its 24-hour trading volume increased by an astonishing 271.02% to $2,951,876,758. If the bullish force breaks over the $0.000004354 barrier, the next resistance level will be at $0.000006789.
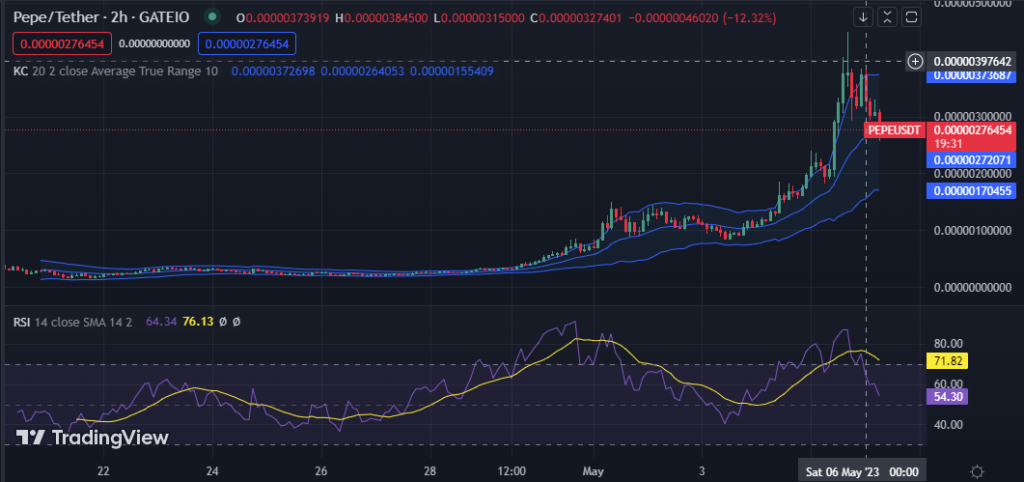
The Keltner Channel bands face North with upper and lower readings of 0.00000373616 and 0.00000170132 on the PEPE 2-hour price chart, signifying a bullish trend. Traders might consider buying PEPE at the current levels with a sell target price near the upper Keltner Channel.
The bullish momentum is backed as green candlesticks form on the PEPE price chart, and price action rises above the middle band. However, traders should be aware of potential resistance levels and use a stop loss to reduce risk if bulls’ power wanes.
The Relative Strength Index (RSI) reading of 54.22, above the 50-point threshold and indicating more buying pressure than selling pressure, supports the bullish momentum. However, since the RSI moves below its signal line, the bullish momentum may wane, hence the need for traders to establish a stop loss.
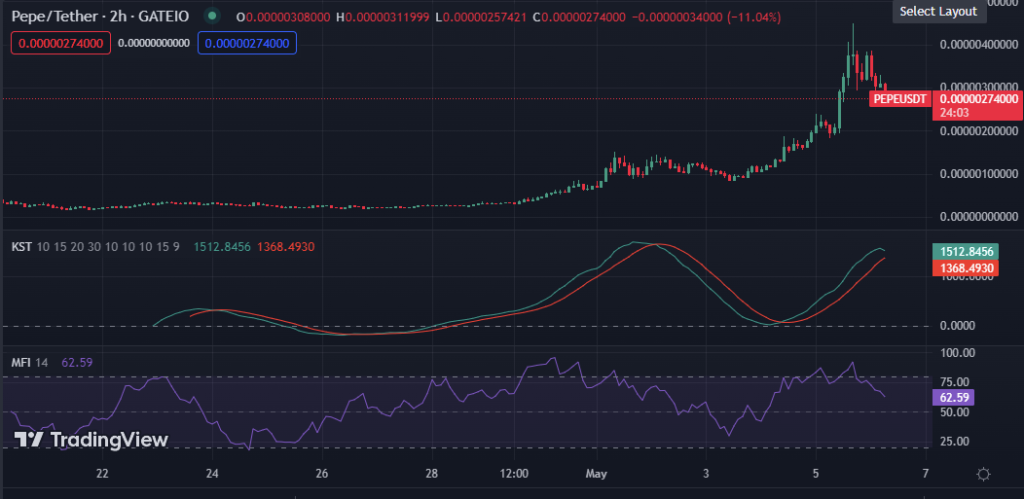
The Know Sure Thing (KST) indicates that bullish momentum is rising in the market with a reading of 1513.4037 and moving above its signal line. If the KST line crosses below the signal line, it may be interpreted as a sell signal, and investors consider selling their long positions or starting new ones.
PEPE has bullish solid momentum with a Money Flow Index (MFI) rating of 62.94, indicating buyers control the market. Until the MFI rating drops below 50, traders may consider holding onto their existing long positions or establishing new ones.
In conclusion, PEPE’s bullish momentum is strong, but traders should be wary of potential resistance levels and overbought situations.
Disclaimer: Cryptocurrency price is highly speculative and volatile and should not be considered financial advice. Past and current performance is not indicative of future results. Always research and consult with a financial advisor before making investment decisions.
- SEO Powered Content & PR Distribution. Get Amplified Today.
- PlatoAiStream. Web3 Data Intelligence. Knowledge Amplified. Access Here.
- Minting the Future w Adryenn Ashley. Access Here.
- Buy and Sell Shares in PRE-IPO Companies with PREIPO®. Access Here.
- Source: https://investorbites.com/pepe-price-analysis-05-06/

