- Nasdaq 100 has remained sluggish and underperformed the Dow Jones Industrial Average since last Friday, 16 February.
- The recent underperformance of the Nasdaq 100 has been triggered by the concentration risk of its significant YTD return contributor, Nvidia.
- The options market has priced in around an 11% move in either direction on the share price of Nvidia after it reports its Q4 2023 earnings results later today.
- Nasdaq 100 faces the risk of a potential multi-week corrective decline unfolding; immediate supports to watch will be at 17,350 and 17,160.
This is a follow-up analysis of our prior report, “US stock market bulls are facing a reality check (3 ominous signs to watch)” published on 14 February 2024. Click here for a recap.
The Nasdaq 100, the top outperformer among the major US benchmark stock indices has remained sluggish since last Friday, 16 February.
Yesterday, the mega-cap technology stocks heavy-weighted Nasdaq 100 slipped by -0.79% after shedding as much as -1.62% intraday. In contrast, the Dow Jones Industrial Average only recorded a minor loss of -0.17%
Concentration risk in Nvidia
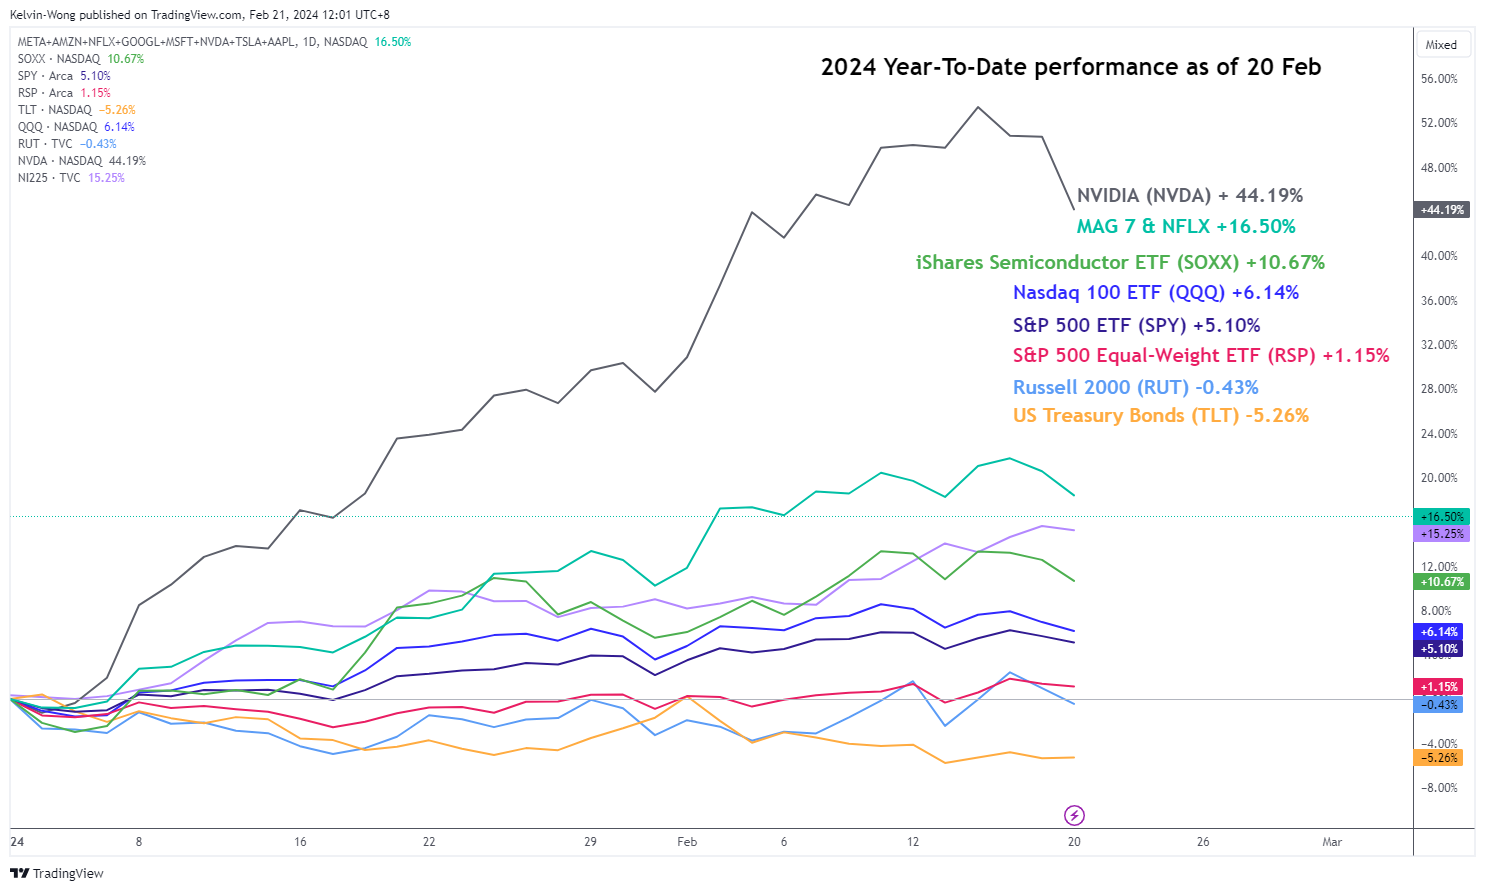
Fig 1: YTD performance of major US benchmark stock indices & key ETFs as of 20 Feb 2024 (Source: TradingView, click to enlarge chart)
The main culprit to blame for the Nasdaq 100’s current short-term underperformance over the Dow Jones Industrial Average has been the horrendous sell-off seen in the share price of Nvidia yesterday where it plummeted by -4.35% with a maximum intraday loss of -6.58%, its worst daily return since 17 October 2023 ahead of its Q4 2023 earnings result release today after the close of the US session.
Market participants have started to remain weary of the high growth earnings expectations being placed on Nvidia, being the leader of the ongoing Artificial Intelligence (AI) high productivity and business cycle revolution optimism theme play. Analysts’ consensus expectations have set a high bar for Nvidia’s Q4 2023 earnings per share to come in at $4.59, that’s a whopping gain of +420% y/y over the same quarter a year ago.
A Wall Street Journal report dated yesterday, 20 February has cited data obtained from Cboe Global Markets that the options market has priced in around an 11% move in either direction on the share price of Nvidia after it reports its earnings later today at the close of the US session. The expected 11% move is based on an option trade known as a straddle which entails purchasing puts and calls at the same strike price.
Notably, market participants have turned cautious about the state of the US stock market as a significant portion of the current year-to-date (YTD) of the S&P 500 has been contributed by a huge portion from Nvidia’s YTD return of +44 % with a current peak of +53% seen earlier on 14 February (see Fig 1) that surpassed the YTD returns of Nasdaq 100 by 7 times, and a wider margin of 38 times on the equal-weight S&P 500.
Bearish “Ascending Wedge” breakdown
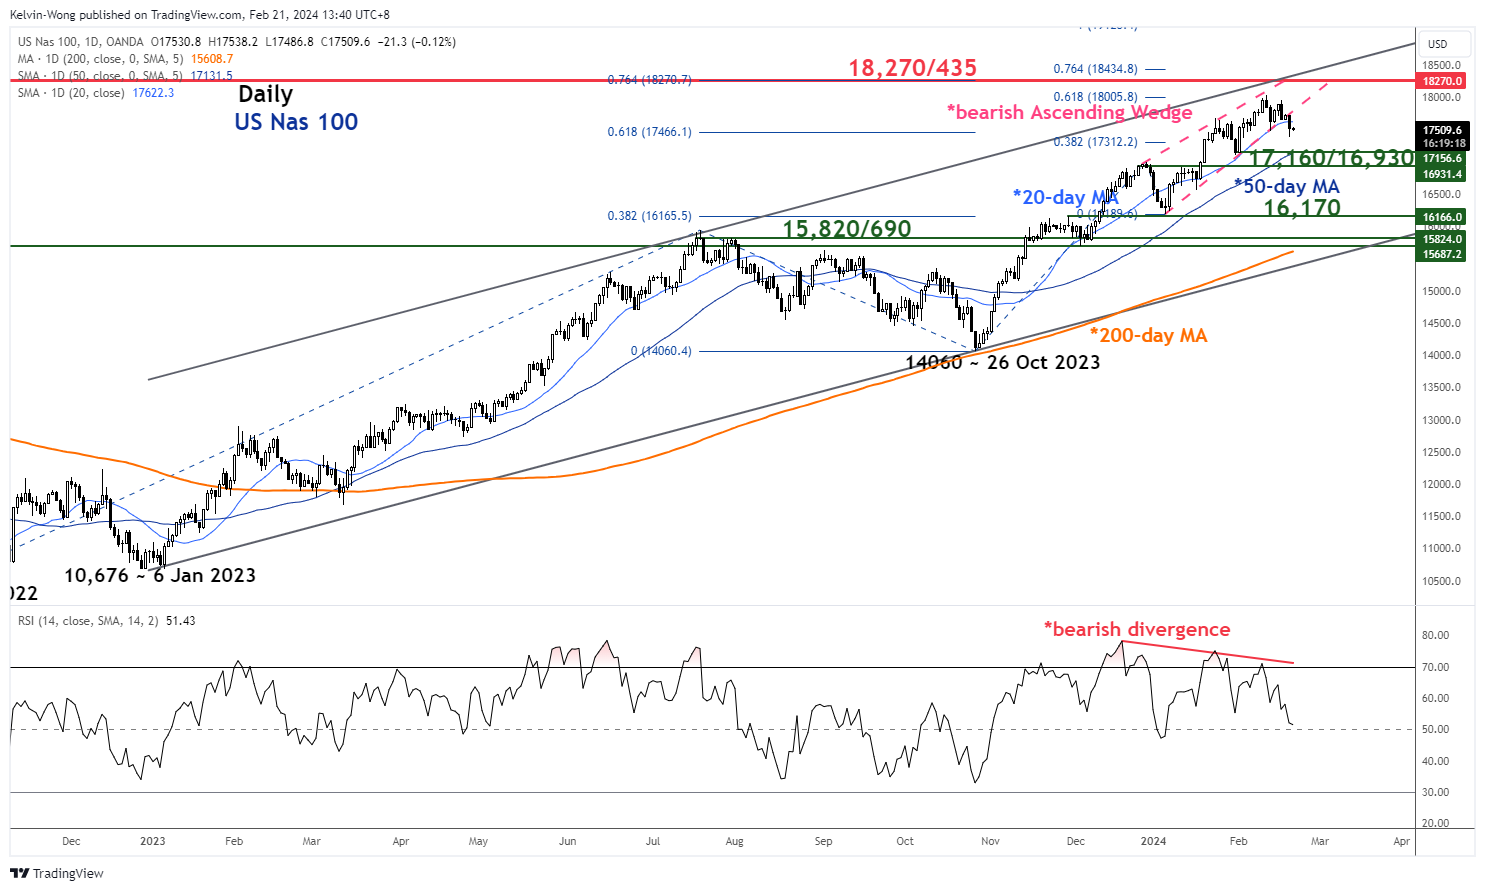
Fig 2: US Nas 100 medium-term & major trends as of 21 Feb 2024 (Source: TradingView, click to enlarge chart)
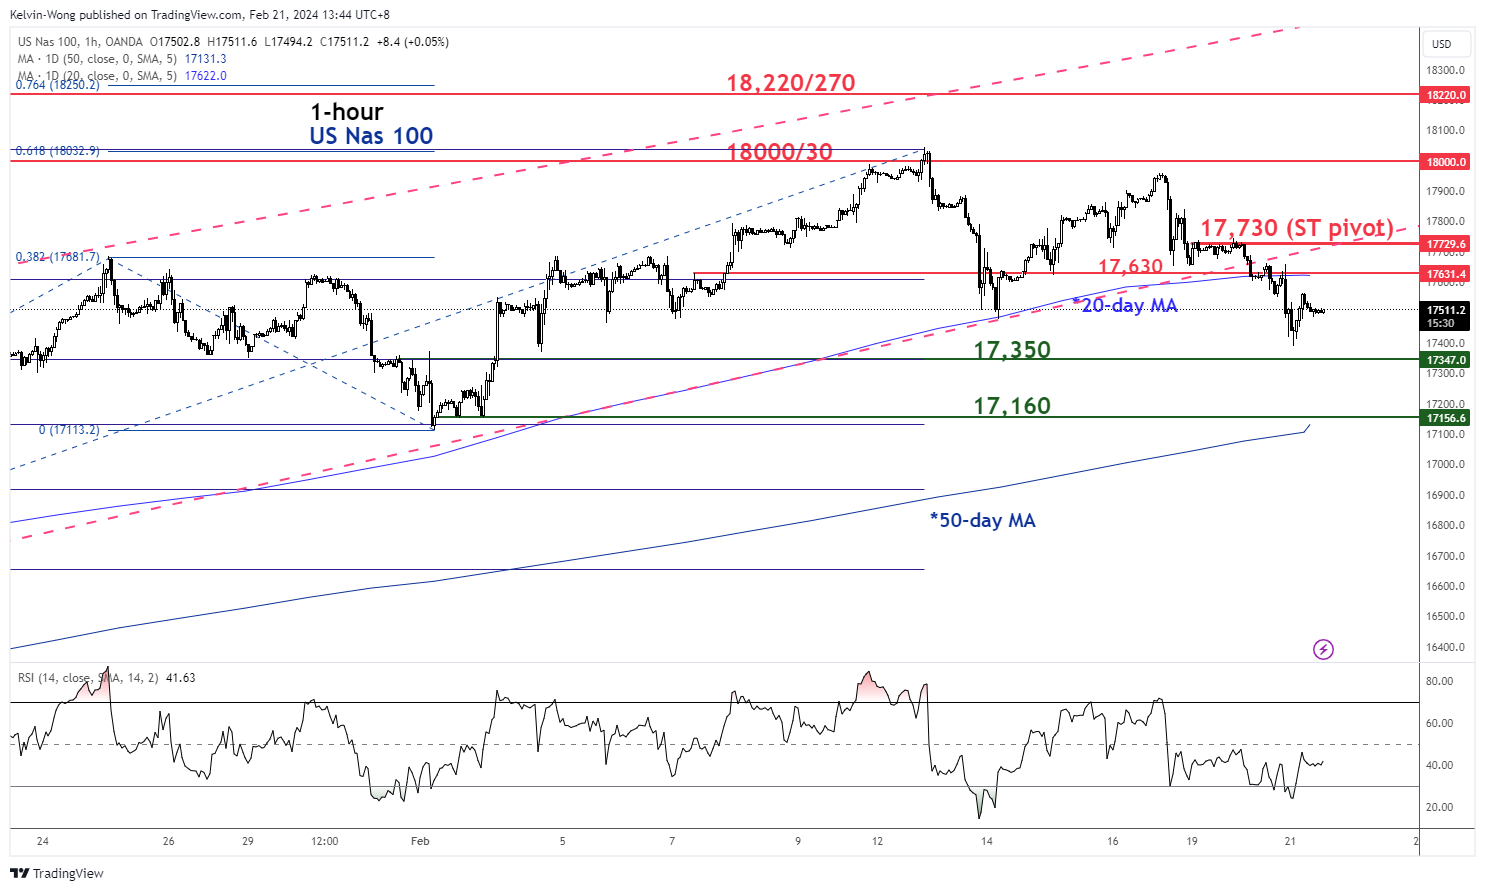
Fig 3: US Nas 100 short-term trend as of 21 Feb 2024 (Source: TradingView, click to enlarge chart)
Yesterday’s sell-off seen in the US Nas 100 Index (a proxy for the Nasdaq 100 futures) has led to a breakdown on the lower boundary of its medium-term bearish “Ascending Wedge” configuration that also confluences with the 20-day moving average that acted as a prior support at 17,630.
In addition, the daily RSI momentum indicator has flashed a bearish divergence condition since 24 January at its overbought region. These observations have increased the risk of a potential medium-term (multi-week) corrective decline unfolding within the Index’s ongoing major uptrend phase in place since the 6 January 2023 swing low.
On a short-term horizon, as seen in the hourly chart, the key short-term pivotal resistance to watch will be at 17,730 (pull-back of the former “Ascending Wedge” support & 61.8% Fibonacci retracement of the recent slide from 16 February 2024 high to 21 February 2024 low).
If 17,730 is not surpassed to the upside, the Index may exhibit further weakness to expose the next intermediate supports at 17,350 and 17,160 (also the upward-sloping 50-day moving average) in the first step.
On the other hand, a clearance above 17,730 invalidates the bearish tone to see a retest on the current all-time high area of 18,000/18,030.
Content is for general information purposes only. It is not investment advice or a solution to buy or sell securities. Opinions are the authors; not necessarily that of OANDA Business Information & Services, Inc. or any of its affiliates, subsidiaries, officers or directors. If you would like to reproduce or redistribute any of the content found on MarketPulse, an award winning forex, commodities and global indices analysis and news site service produced by OANDA Business Information & Services, Inc., please access the RSS feed or contact us at [email protected]. Visit https://www.marketpulse.com/ to find out more about the beat of the global markets. © 2023 OANDA Business Information & Services Inc.
Passionate about connecting the dots in the financial markets and sharing perspectives around trading and investment, Kelvin Wong is an expert in using a unique combination of fundamental and technical analyses, specializing in Elliott Wave and fund flow positioning, to pinpoint key reversal levels in the financial markets.
In addition, over the last ten years, Kelvin has conducted numerous market outlook and trading-related seminars, as well as technical analysis training courses, for thousands of retail traders.
Latest posts by Kelvin Wong (see all)
- SEO Powered Content & PR Distribution. Get Amplified Today.
- PlatoData.Network Vertical Generative Ai. Empower Yourself. Access Here.
- PlatoAiStream. Web3 Intelligence. Knowledge Amplified. Access Here.
- PlatoESG. Carbon, CleanTech, Energy, Environment, Solar, Waste Management. Access Here.
- PlatoHealth. Biotech and Clinical Trials Intelligence. Access Here.
- Source: https://www.marketpulse.com/indices/nasdaq-100-technical-torpedoed-by-nvidia-at-risk-of-undergoing-multi-week-corrective-decline/kwong

