- Bullish tone dissipated last Friday, 15 September ex-post Arm’s IPO spectacularly first-day positive performance as the Nasdaq 100 had a weekly close below the 50-day moving average for the 4th time in the past six weeks.
- Rising market-based inflationary expectations in line with recent magnificent rallies seen in oil prices may cause the Fed to be less dovish on the timing to enact the first interest rate cut in 2024.
- 15,540 is the key short-term resistance to watch.
This is a follow-up analysis of our prior report, “Nasdaq 100 Technical: Bearish momentum reasserts” published on 25 August 2025. Click here for a recap.
The price actions of the US Nas 100 Index (a proxy for the Nasdaq 100 futures) have whipsawed in the past four weeks, it cleared above the 15,135 short-term resistance (also the 20-day moving average) as highlighted in our previous report but the bulls failed to make any headway above the 15,460/15,540 medium-term resistance and staged a weekly close below its 50-day moving average on last Friday, 15 September.
Last week’s bullish hesitancy is primarily driven by the fears that the US central bank, the Fed in the upcoming FOMC meeting this coming Wednesday, 20 September together with the latest “dot-plot” release may indicate a stance or guidance that a higher level of interest rate can persist for a longer period of time after the last hike on the Fed funds rate in 2023 (either in the November or December FOMC based on interest rates futures data from CME FedWatch tool as of 18 September 2023).
Rising market-based inflationary expectations may catch dovish market participants off guard
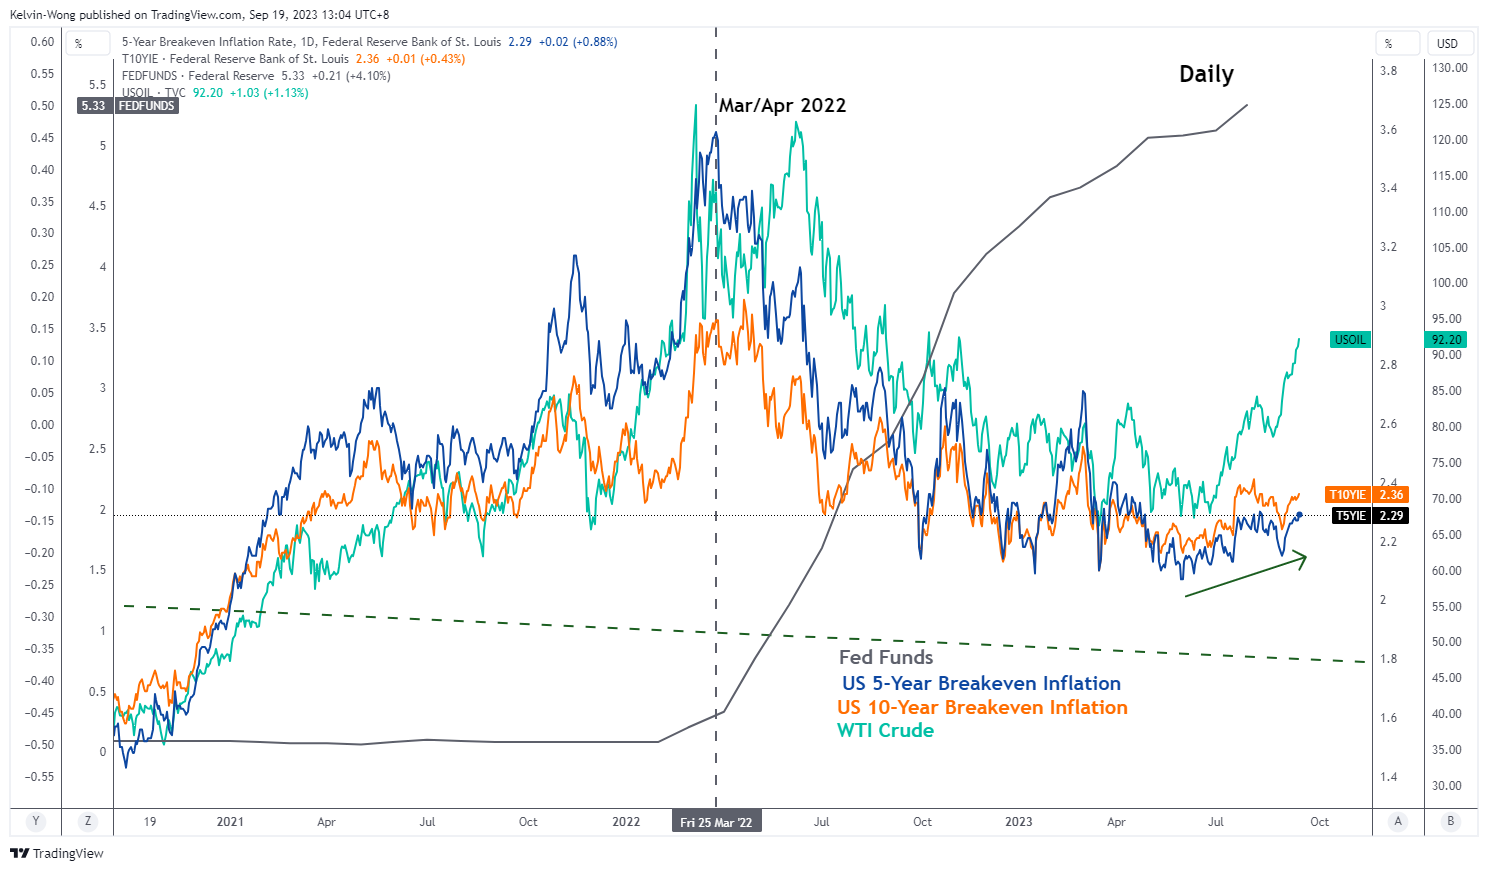
Fig 1: Correlation between WTI crude oil and US 5-year & 10-year breakeven inflation rates as of 19 Sep 2023 (Source: TradingView, click to enlarge chart)
A potential Fed’s guidance that indicates a persistent longer period of higher interest rates for next year that stretches beyond Q2 of 2024 due to higher oil prices that have driven up market-based inflationary expectations (5-year & 10-year break-even inflation rates) may catch the market off guard as there is a high chance of 55% for the Fed to enact its first interest rate cut in June 2024 FOMC as inferred from the CME FedWatch tool.
The US Nas 100 Index falls under the “long-duration” risk asset classification that is vulnerable to a higher interest rates environment that persists for a longer-term horizon where profit margins of the top component stocks; the magnificent seven mega-caps (Apple, Amazon, Alphabet, Meta, Microsoft, Tesla & Nvidia) are primarily dependent on longer-term revenues or cash inflows that are likely to be received further far out in the future which in turn tend to have lower present values if discounted by a higher interest rate factor, hence higher opportunity costs for holding such mega-cap stocks.
To offset such potentially higher opportunity costs, the current lofty valuations (forward price to earnings ratios) of these mega-cap stocks need to come down considerably either by higher earnings growth or lower share prices. If the global demand environment remains lackluster or even slips into a recession or stagflation in 2024, the latter is more likely to occur which can put downside pressure on the US Nas 100 Index.
Medium-term momentum remains bearish
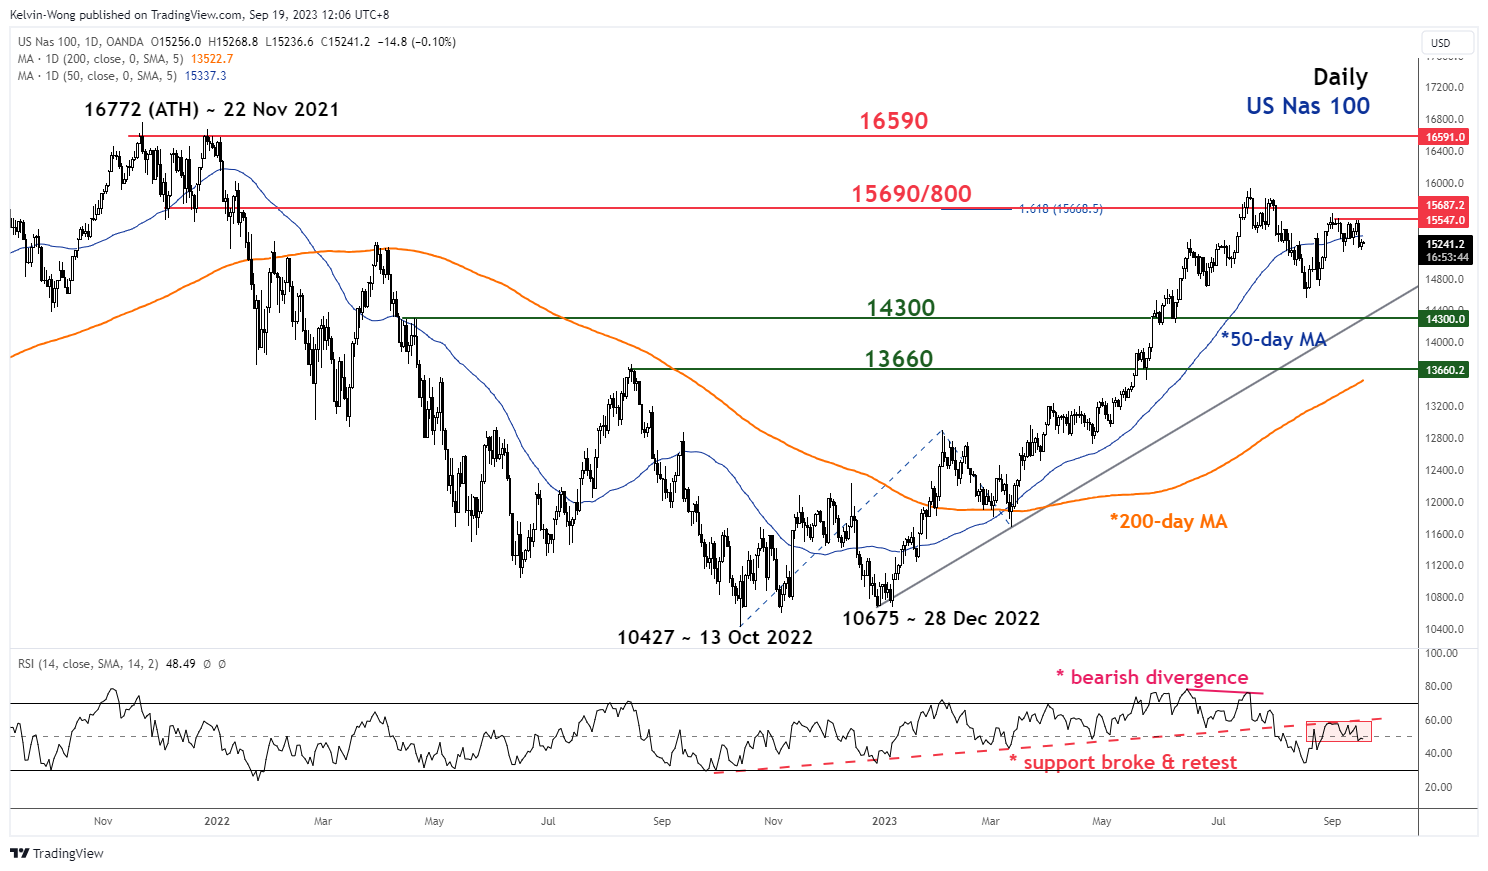
Fig 2: US Nas 100 medium-term trend as of 19 Sep 2023 (Source: TradingView, click to enlarge chart)
Last week’s close below the 50-day moving average of the US Nas 100 Index has occurred in conjunction with a bearish momentum condition reading as indicated by the daily RSI.
The daily RSI has inched downwards and shaped a “lower low” right below a former key parallel ascending support now turns pull-back resistance at the 60 level which suggests a potential resurgence of medium-term bearish momentum.
Price actions have broken down below the 20-day moving average
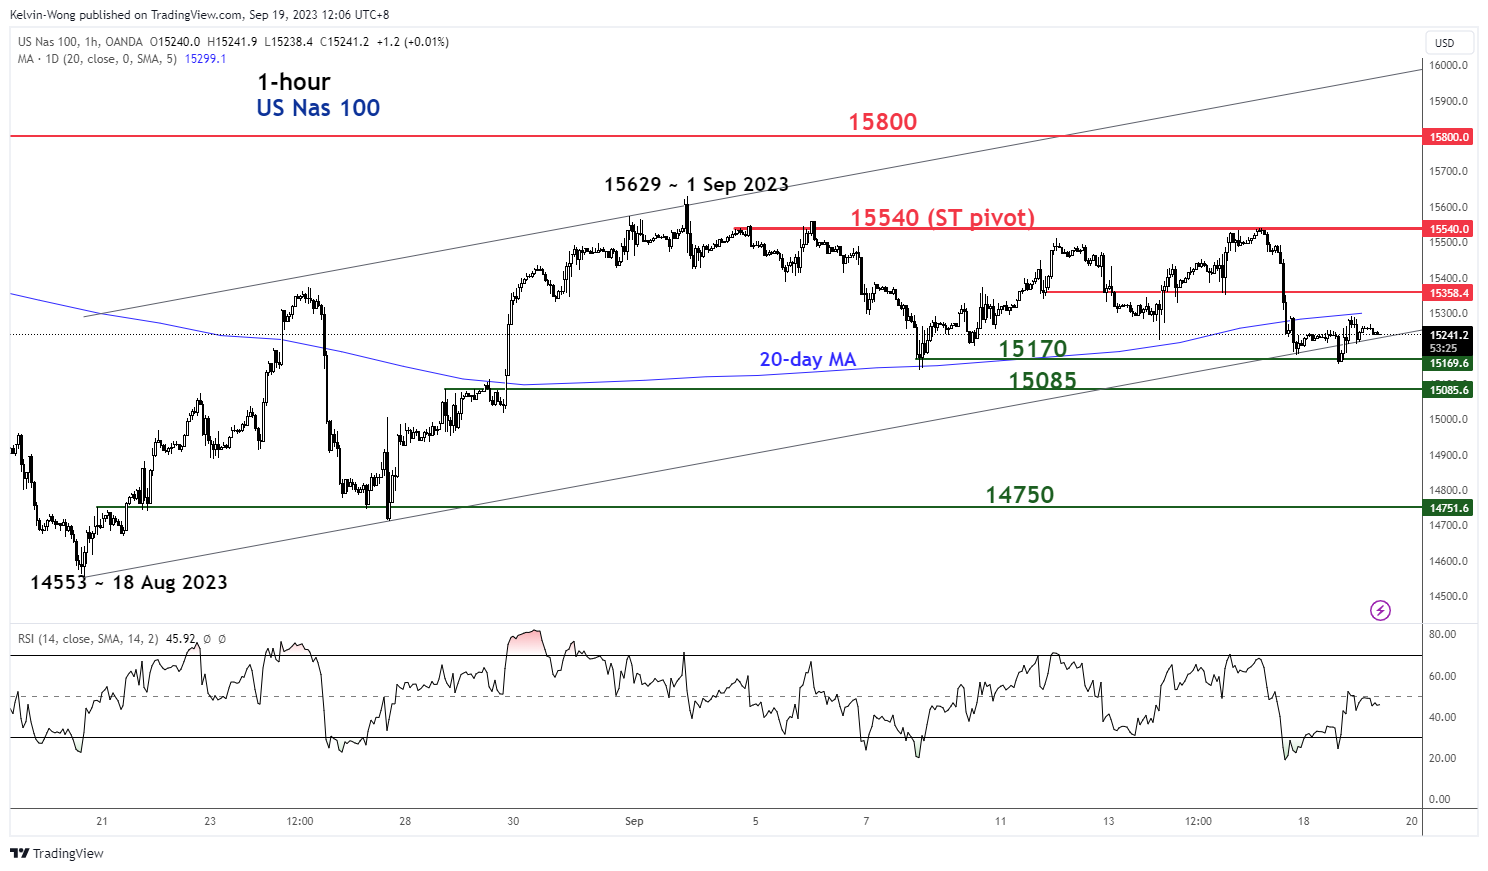
Fig 3: US Nas 100 minor short-term trend as of 19 Sep 2023 (Source: TradingView, click to enlarge chart)
Last Friday’s 15 September price actions of the Index staged a bearish breakdown below its 20-day moving average and yesterday’s 18 September minor rebound seen at the start of the US session has halted at the 20-day moving average. These observations suggest that short-term bearish momentum remains intact.
Watch the 15,540 key short-term pivotal resistance and a break below 15,085 may trigger a further slide towards the next intermediate support at 14,750 in the first step.
On the other hand, a clearance above 15,540 invalidates the bearish tone for the next intermediate resistance to come in at 15,800 (27 July/ 29 July 2023 minor swing highs).
Content is for general information purposes only. It is not investment advice or a solution to buy or sell securities. Opinions are the authors; not necessarily that of OANDA Business Information & Services, Inc. or any of its affiliates, subsidiaries, officers or directors. If you would like to reproduce or redistribute any of the content found on MarketPulse, an award winning forex, commodities and global indices analysis and news site service produced by OANDA Business Information & Services, Inc., please access the RSS feed or contact us at [email protected]. Visit https://www.marketpulse.com/ to find out more about the beat of the global markets. © 2023 OANDA Business Information & Services Inc.
Latest posts by Kelvin Wong (see all)
- SEO Powered Content & PR Distribution. Get Amplified Today.
- PlatoData.Network Vertical Generative Ai. Empower Yourself. Access Here.
- PlatoAiStream. Web3 Intelligence. Knowledge Amplified. Access Here.
- PlatoESG. Carbon, CleanTech, Energy, Environment, Solar, Waste Management. Access Here.
- PlatoHealth. Biotech and Clinical Trials Intelligence. Access Here.
- BlockOffsets. Modernizing Environmental Offset Ownership. Access Here.
- Source: https://www.marketpulse.com/indices/nasdaq-100-technical-slipped-back-below-50-day-moving-average-as-fed-fomc-looms/kwong

