- The current bullish movement seen in the US Nasdaq 100 is primarily driven by an ongoing multi-week slide in the US 10-year Treasury yield.
- Market breadth has improved remarkably where the number of component stocks in the Nasdaq 100 that are trading above their 200-day moving averages jumped to 67%.
- Watch the key short-term support at 15,765/15,690.
A major shift in calculus has taken form in the dynamics of the US stock market where long-duration growth US equities have outperformed in the past two weeks with risk-on-herding behaviour.
The primary driver of this abrupt bullish sentiment has been the recent softness in the long-term cost of funding depicted by the benchmark US 10-year Treasury yield. It has declined by 61 basis points from its 5.02% high printed on 23 October 2023 to yesterday, 20 November low of 4.41%; also its steepest decline since the period of 2 March 2023 to 4 May 2023.
The current bout of weakness seen in the US 10-year Treasury yield ex-post release of the softer US CPI print for October implies that the US Federal Reserve’s current interest rate hike cycle on the Fed funds rate may have reached a terminal level of 5.25%-5.50% with low odds of an interest rate hike in next month, December FOMC meeting and even the entire months of 2024 based on the current pricing calculated by the CME FedWatch tool.
These latest implications suggest that the next potential scenario in US monetary policy is likely to be less restrictive with a chance of 29.5% for the first interest rate cut to be enacted as early as in the March 2024 FOMC meeting which in turn supports the current bullish outperformance seen in Nasdaq 100 that is heavily weighted in long-duration growth equities such as the seven mega-cap cohort (Apple, Amazon, Alphabet, Meta, Microsoft, Tesla & Nvidia).
14% rally after a retest on its 200-day moving average
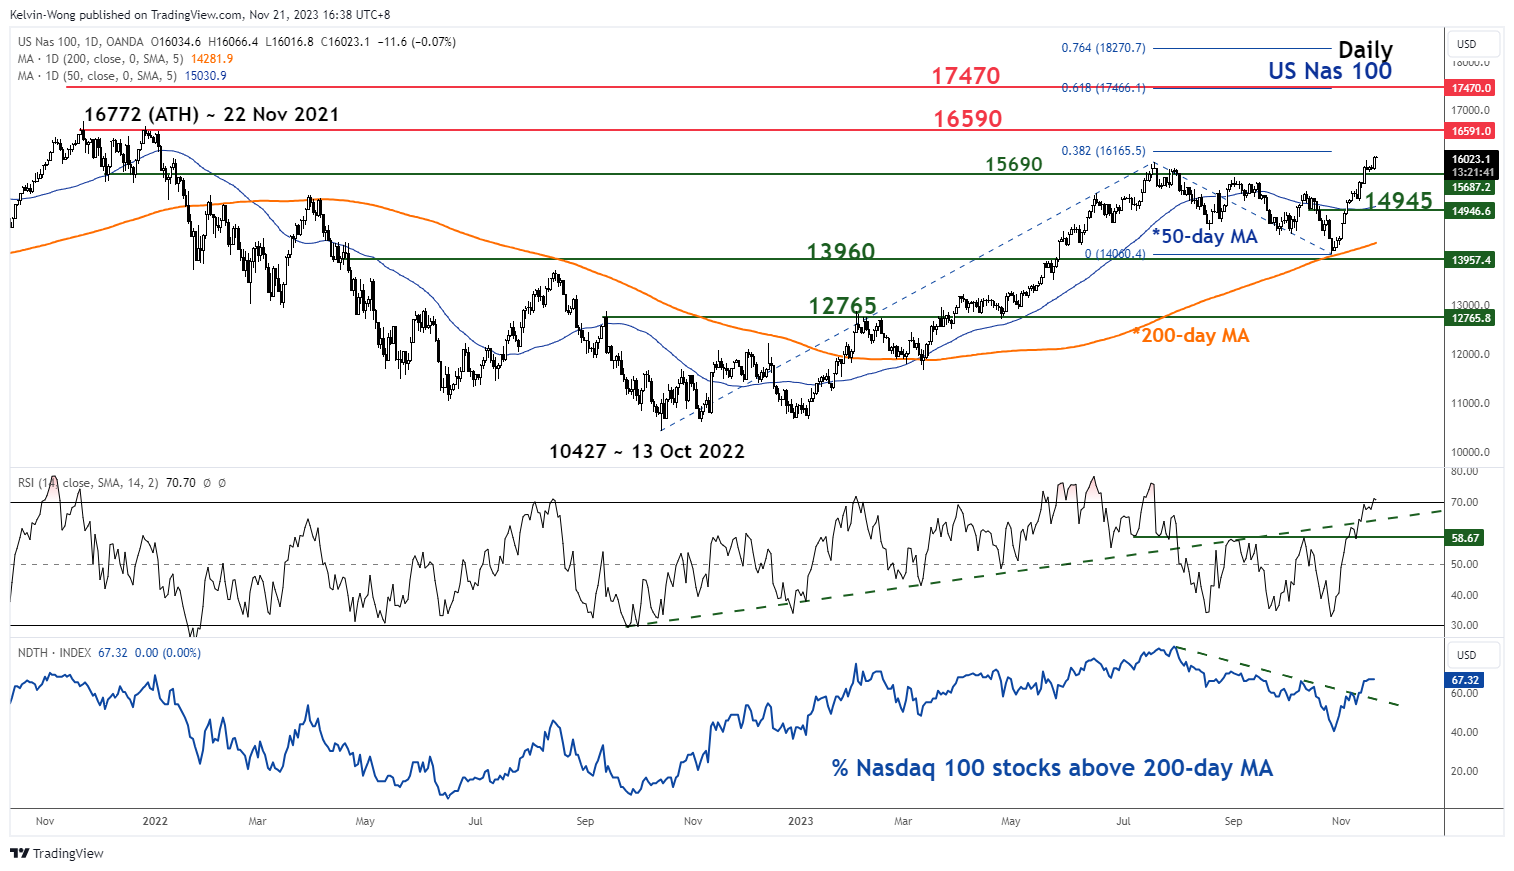
Fig 1: US Nas 100 medium-term trend as of 21 Nov 2023 (Source: TradingView, click to enlarge chart)
The US Nas 100 Index (a proxy for the Nasdaq 100 futures) has staged a significant accumulated return of 14% since the retest of its 200-day moving average on 26 October 2023.
It has surpassed its 50-day moving average and erased the entire ex-post-summer losses inflicted from mid-July 2023 to the end of October 2023.
In addition, market breadth has improved remarkably as well where the percentage of Nasdaq 100 component stocks that are trading above their respective 200-day moving average has increased to 67% as of yesterday, 20 November.
Short-term uptrend phase remains intact
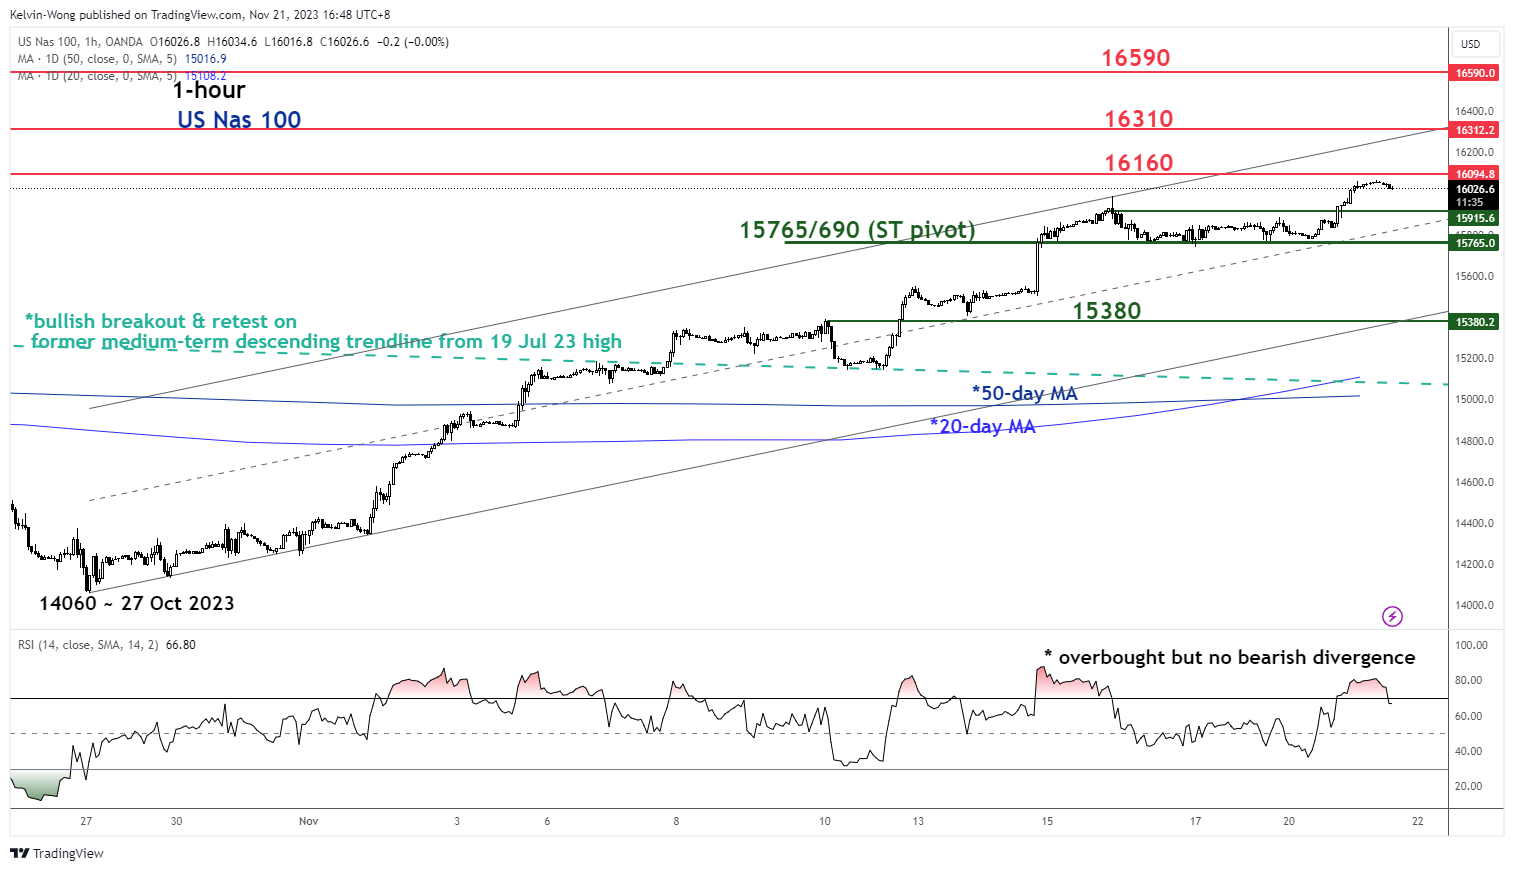
Fig 2: US Nas 100 minor short-term trend as of 21 Nov 2023 (Source: TradingView, click to enlarge chart)
Price actions of the US Nas 100 Index have continued to oscillate within a minor short-term ascending channel in place since the 27 October 2023 low of 14,060.
The hourly RSI momentum indicator has just exited from its overbought region but without any bearish divergence condition. This observation suggests that price actions of the Index may shape a minor pull-back within the short-term ascending channel rather than a deeper bearish reversal scenario.
Watch the 15,765/15,690 key short-term pivotal support (the minor swing low areas of 16/17 November 2023 & median line of the short-term ascending channel) to maintain the current impulsive upmove sequence. A clearance above the near-term resistance of 16,160 sees the next intermediate resistance coming in at 16,310 (upper boundary of the short-term ascending channel) in the first step.
On the flip side, a break below 15,690 negates the bullish tone to expose the next intermediate support at 15,380 (also the lower boundary of the short-term ascending channel).
Content is for general information purposes only. It is not investment advice or a solution to buy or sell securities. Opinions are the authors; not necessarily that of OANDA Business Information & Services, Inc. or any of its affiliates, subsidiaries, officers or directors. If you would like to reproduce or redistribute any of the content found on MarketPulse, an award winning forex, commodities and global indices analysis and news site service produced by OANDA Business Information & Services, Inc., please access the RSS feed or contact us at [email protected]. Visit https://www.marketpulse.com/ to find out more about the beat of the global markets. © 2023 OANDA Business Information & Services Inc.
Latest posts by Kelvin Wong (see all)
- SEO Powered Content & PR Distribution. Get Amplified Today.
- PlatoData.Network Vertical Generative Ai. Empower Yourself. Access Here.
- PlatoAiStream. Web3 Intelligence. Knowledge Amplified. Access Here.
- PlatoESG. Carbon, CleanTech, Energy, Environment, Solar, Waste Management. Access Here.
- PlatoHealth. Biotech and Clinical Trials Intelligence. Access Here.
- Source: https://www.marketpulse.com/indices/nasdaq-100-technical-relentless-bullish-move/kwong

