- Nasdaq 100 recent bullish trend has moved in synch with a significant improvement in the net US liquidity since late October 2023.
- The major liquidity contributor has been a significant drawdown in the Fed’s overnight reverse repo facility that negates the adverse effects of Quantitative Tightening (QT).
- Watch the 16,160 key short-term support ahead of Fed’s FOMC.
This is a follow-up analysis of our prior report, “Nasdaq 100 Technical: Impending corrective decline within major uptrend” published on 7 December 2023. Click here for a recap.
The tech-heavy Nasdaq 100 has continued its relentless uptrend after it failed to break below the highlighted downside trigger 15,690 level in our previous analysis and cleared above the 16,160 minor range resistance in place since 22 November 2023 on Monday, 11 December.
So far, the Nasdaq 100 has recorded a month-to-date gain of +2.55% in December that outperformed the S&P 500 (+1.66%) and Dow Jones Industrial Average (1.74%) except against the small-caps Russell 2000 (+3.99%) as of 12 December 2023.
On the surface, the ongoing optimism seen in the major US benchmark stock indices since late October 2023 seems to be primarily driven by an increasing expectation of a dovish US Federal Reserve in 2024; the CME FedWatch tool based on calculations from Fed funds futures pricing has indicated at least four interest rate cuts of 100 basis points (bps) to the Fed funds rate in 2024 with still a rather high chance of 43% for the first rate cut to come early in the March 2024 FOMC meeting despite a better than expected US non-farm payrolls data and a recent uptick in the services inflation year-on-year growth rate for November.
Improvement in net liquidity condition moves in sync with the current bullish trend of Nasdaq 100
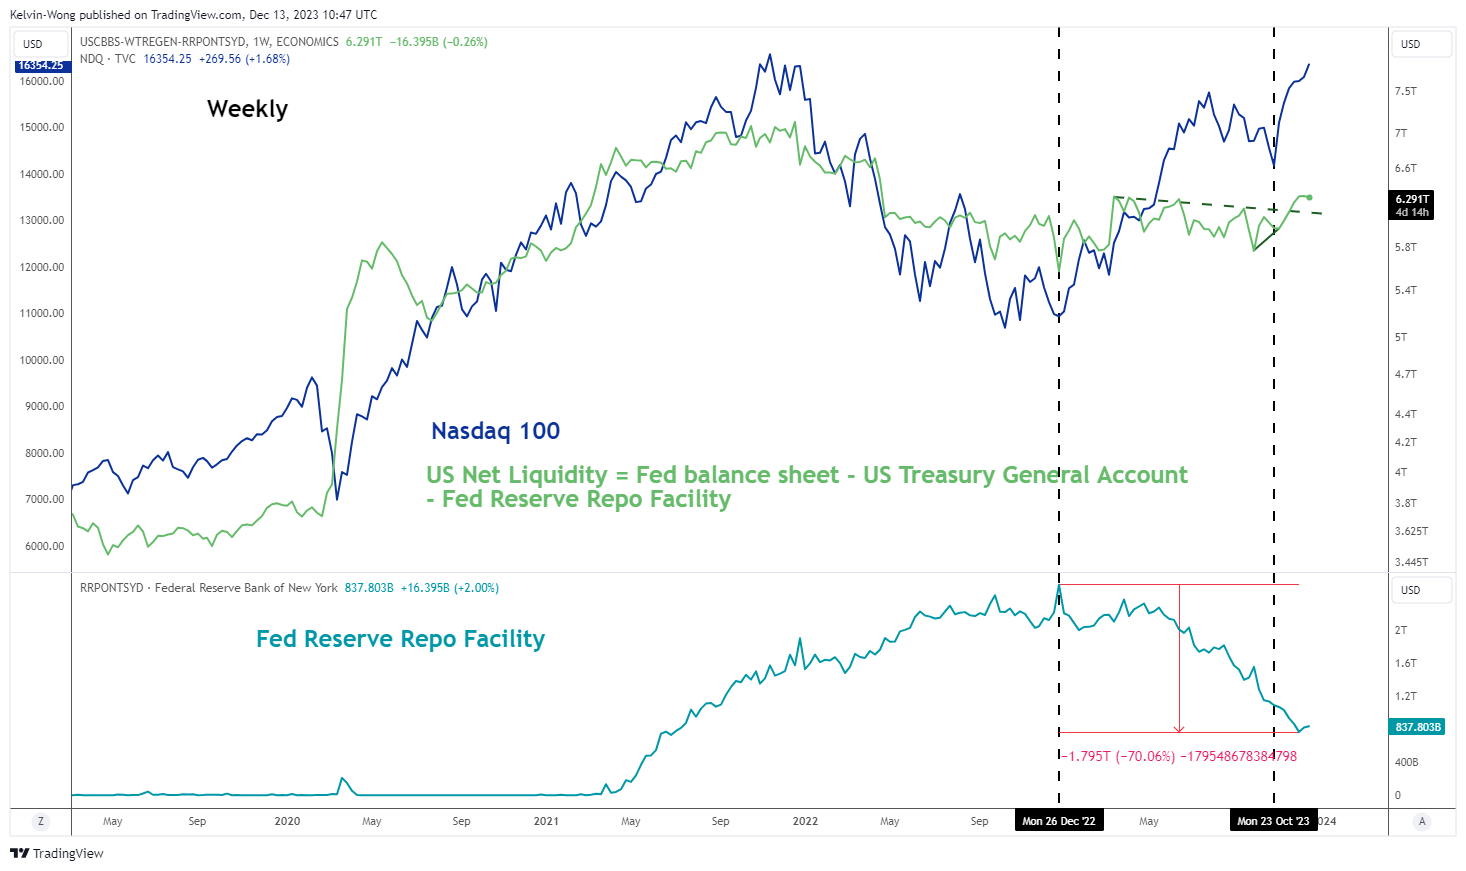
Fig 1: US net liquidity condition with Nasdaq 100 as of 13 Dec 2023 (Source: TradingView, click to enlarge chart)
On closer inspection, the short to medium-term uptrend phases in the Nasdaq 100 together with the rest of the US stock indices are driven by a significant improvement in the net liquidity condition (Fed’s balance sheet minus US Treasury general account & Fed reserve repo facility) since late October 2023.
The most glaring contribution has come from a huge fall in the Fed’s overnight reserve repo facility where US financial institutions such as money market funds park their excess cash with the Fed. Since its peak of US$2.55 trillion in December 2022, it has dwindled by around 70% to US$838.80 billion as of the week starting 11 December 2023. The net effect of lesser usage of such overnight reverse repo facility by money market funds that choose to invest their surplus cash in short-term US Treasury bills instead is likely to negate adverse effects from the ongoing Quantitative Tightening (QT) program enacted by the Fed (see Fig 1).
Watch the 16,160 key short-term support
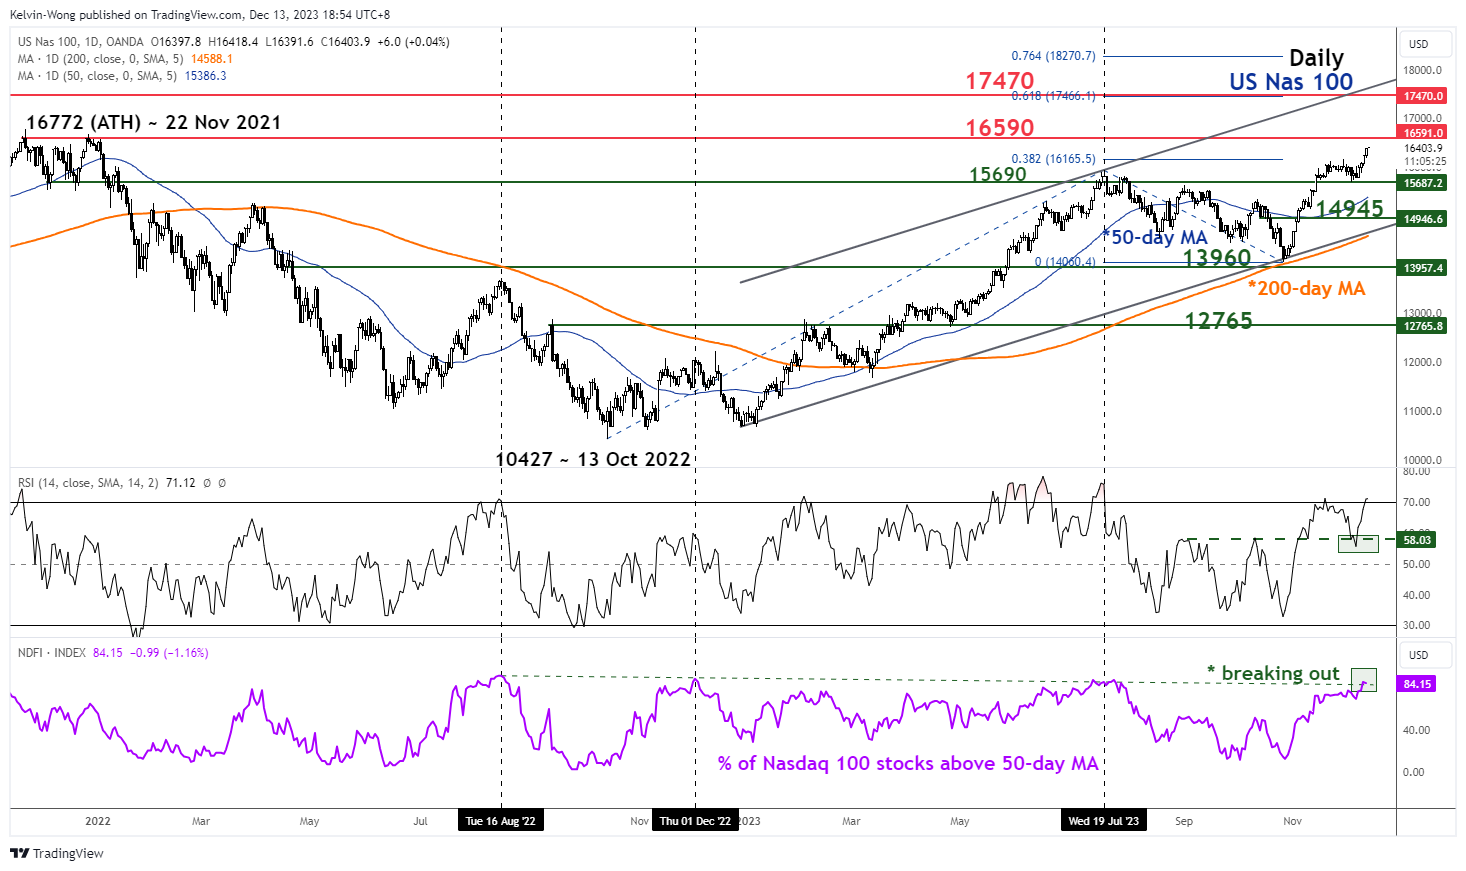
Fig 2: US Nas 100 medium-term trend as of 13 Dec 2023 (Source: TradingView, click to enlarge chart)
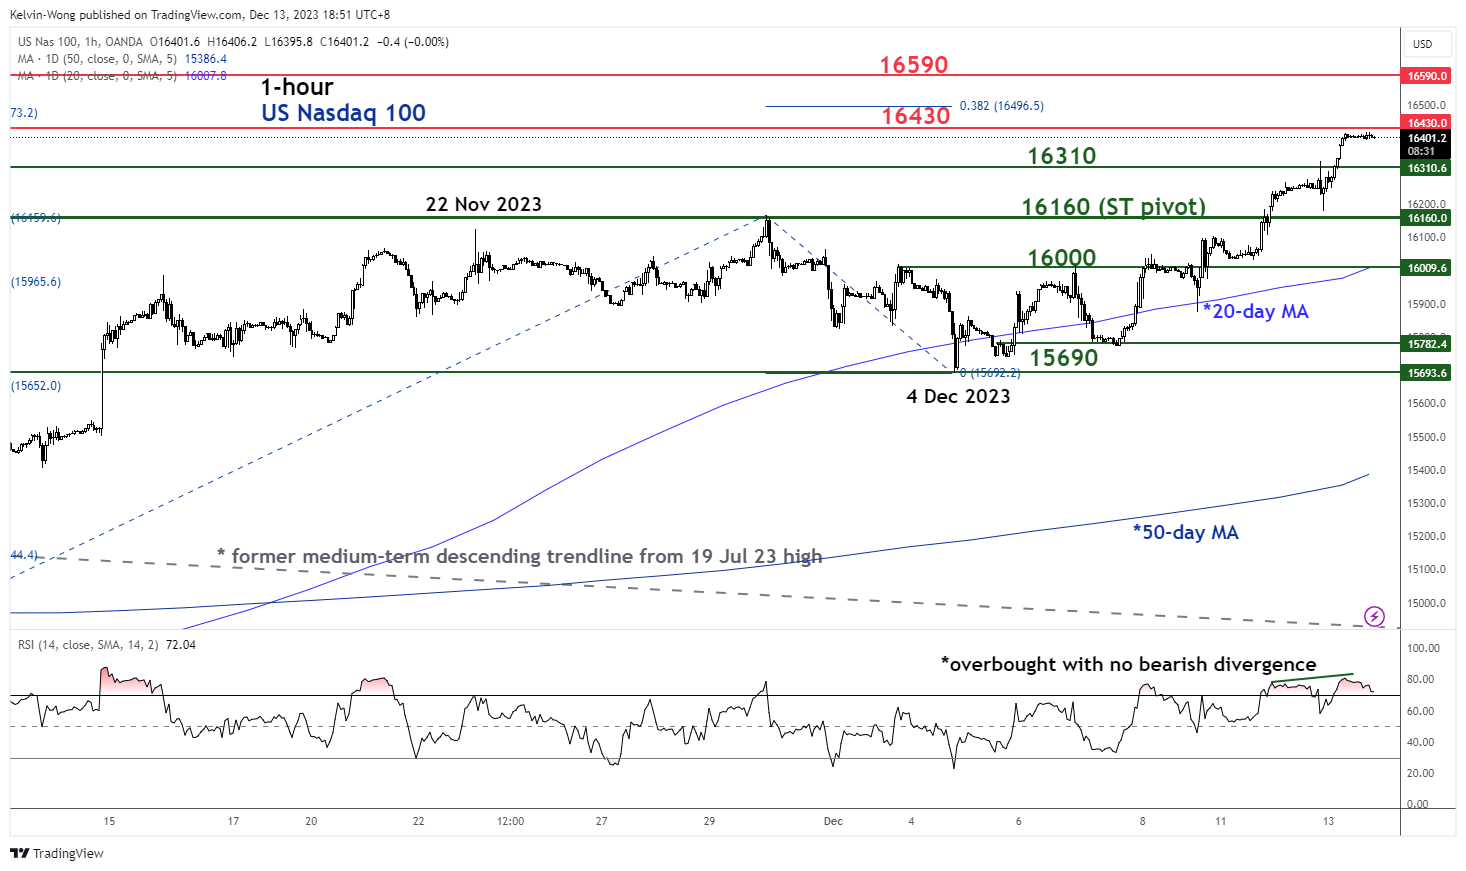
Fig 3: US Nas 100 minor short-term trend as of 13 Dec 2023 (Source: TradingView, click to enlarge chart)
In the run-up to today’s Fed FOMC, the price actions of the US Nas 100 Index (a proxy for the Nasdaq 100 futures) have continued to oscillate within a short-term minor uptrend phase in place since the 4 December 2023 low of 15,690.
Medium-term momentum and breadth readings have improved in the past week as the daily RSI indicator has tested and staged a rebound at a parallel support of 58. In addition, the percentage of Nasdaq 100 components stocks that are above their respective 50-day moving averages have inch higher towards 84%, a bullish breakout from its prior resistance hurdle.
If the 16,160 key short-term pivotal holds, the Index may see its next intermediate resistance coming in at 16,590 in the first step (the range top that comprises its current all-time high of 16,772 printed on 22 November 2021).
On the other hand, failure to hold at 16,160 negates the bullish tone for a deeper minor corrective pull-back to retest the 20-day moving average acting as the next intermediate support at 16,000.
Content is for general information purposes only. It is not investment advice or a solution to buy or sell securities. Opinions are the authors; not necessarily that of OANDA Business Information & Services, Inc. or any of its affiliates, subsidiaries, officers or directors. If you would like to reproduce or redistribute any of the content found on MarketPulse, an award winning forex, commodities and global indices analysis and news site service produced by OANDA Business Information & Services, Inc., please access the RSS feed or contact us at [email protected]. Visit https://www.marketpulse.com/ to find out more about the beat of the global markets. © 2023 OANDA Business Information & Services Inc.
Latest posts by Kelvin Wong (see all)
- SEO Powered Content & PR Distribution. Get Amplified Today.
- PlatoData.Network Vertical Generative Ai. Empower Yourself. Access Here.
- PlatoAiStream. Web3 Intelligence. Knowledge Amplified. Access Here.
- PlatoESG. Carbon, CleanTech, Energy, Environment, Solar, Waste Management. Access Here.
- PlatoHealth. Biotech and Clinical Trials Intelligence. Access Here.
- Source: https://www.marketpulse.com/fundamental/nasdaq-100-its-all-about-liquidity-to-maintain-current-bullish-momentum/kwong

