Executive Summary
- Since October last year, our Altseason Momentum Indicator has flagged a growing appetite from investors to move capital further out on the risk curve.
- Whilst Bitcoin dominance remains significant, there are early signs of more capital rotation into the Ethereum, Solana, Polkadot, and Cosmos ecosystems.
- By investigating Uniswap liquidity pools, we can see that most capital remains in the most mature assets, and whilst TVL is moving out on the risk curve, trade volume has been slower to follow.
Anticipating Altseason
With the new spot Bitcoin ETFs gaining momentum, a bull market in the digital asset space is arguably in play. With this backdrop, we will continue exploring the question of capital rotation into altcoins we covered in WoC 04. In this edition, we will focus on how assets are performing further out on the the risk curve.
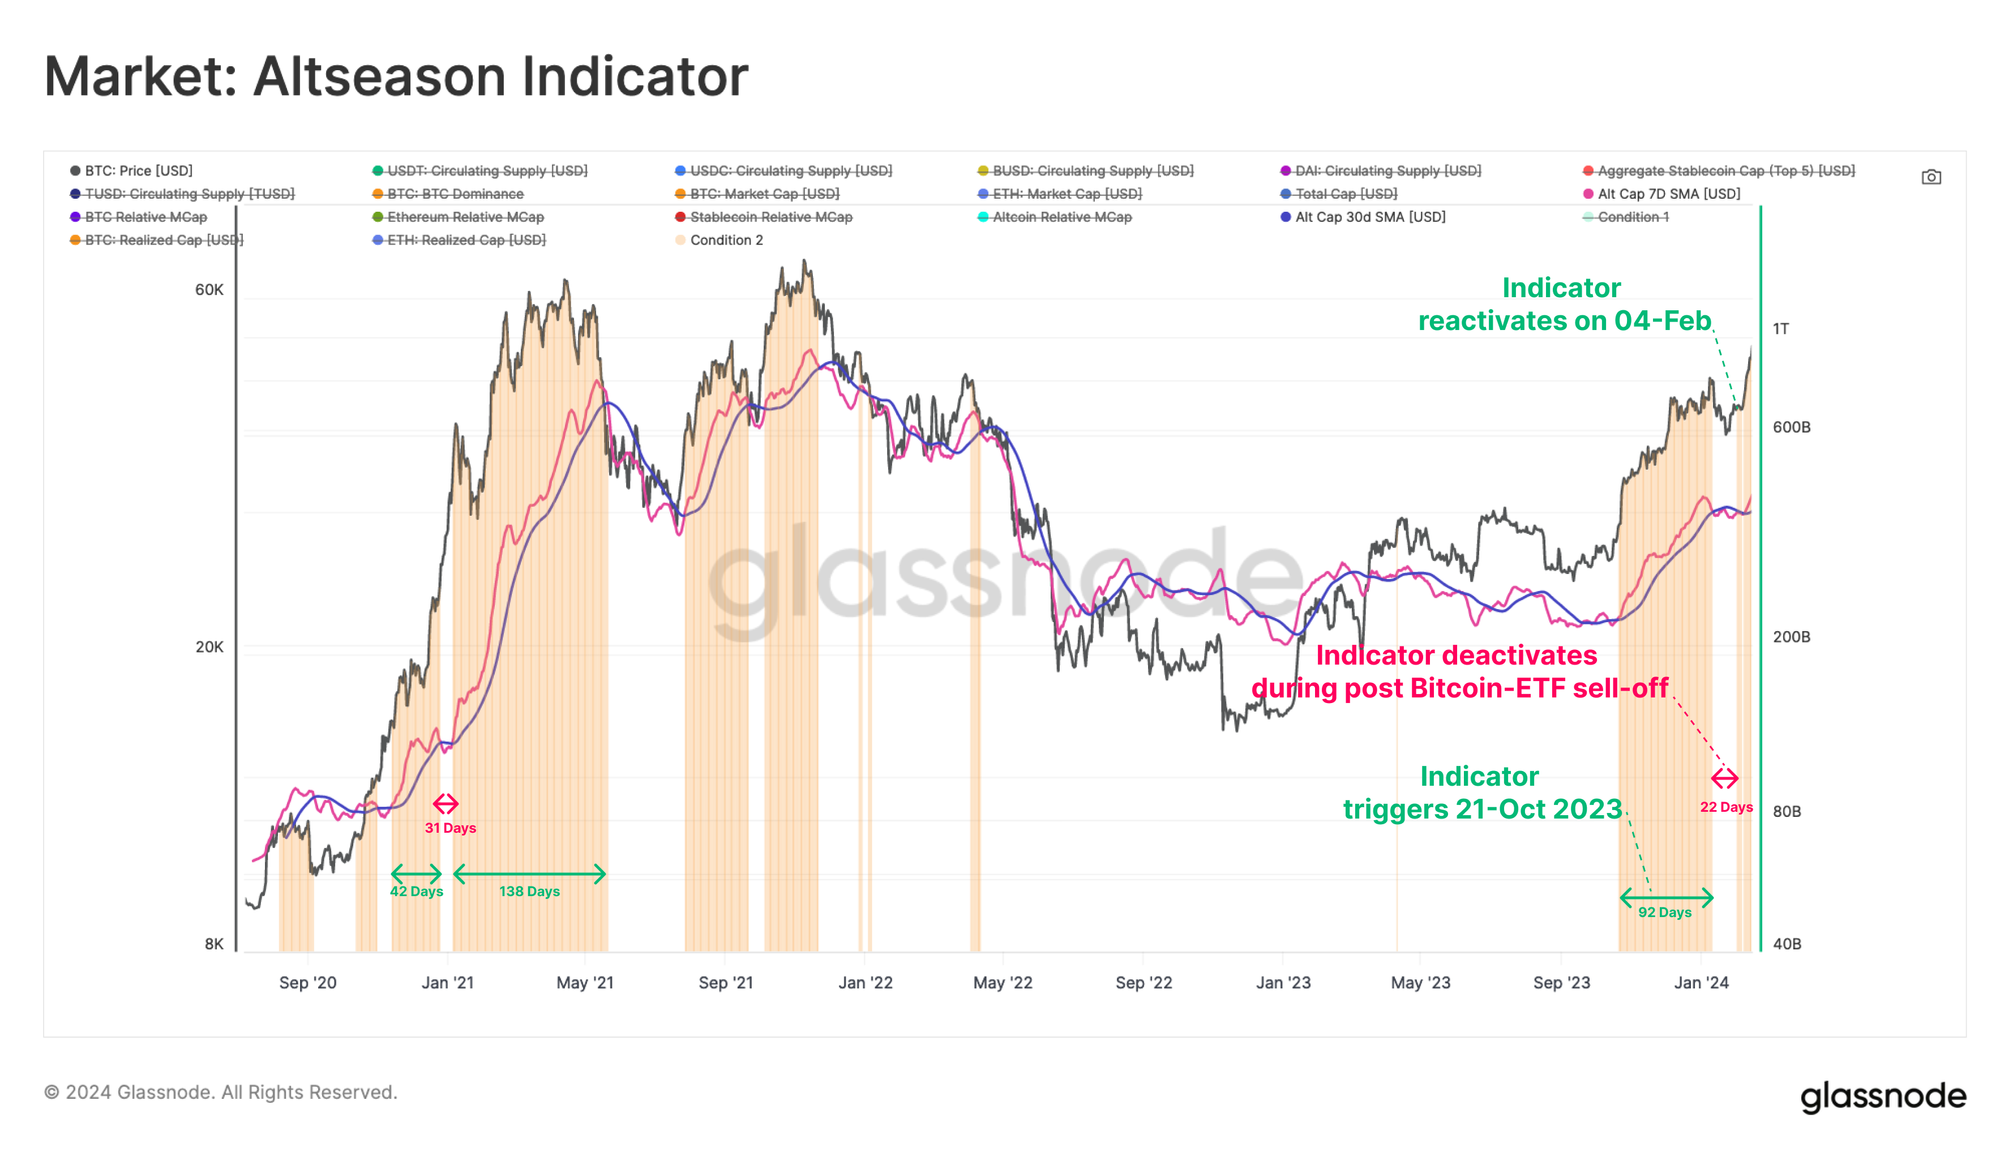
The goal is to assess how capital rotates and flows into the altcoin markets. We will again consult our Altseason Indicator as a macro indicator (see WoC-41-2023). This indicator assesses whether positive momentum is building within the Total Altcoin Cap, alongside continuous capital inflows into BTC, ETH, and Stablecoins.
Our Altcoin Indicator has signalled positive momentum since October last year, with a brief pause during the sell-the-news event after the Bitcoin-ETFs went live. It re-triggered on the 4-Feb.
In terms of market cap dominance, Bitcoin continues to lead with over 52% market share of the total digital asset market cap. In contrast, ETH accounts for 17%, stablecoins 7%, and 24% by the remainder of the Altcoin sector.

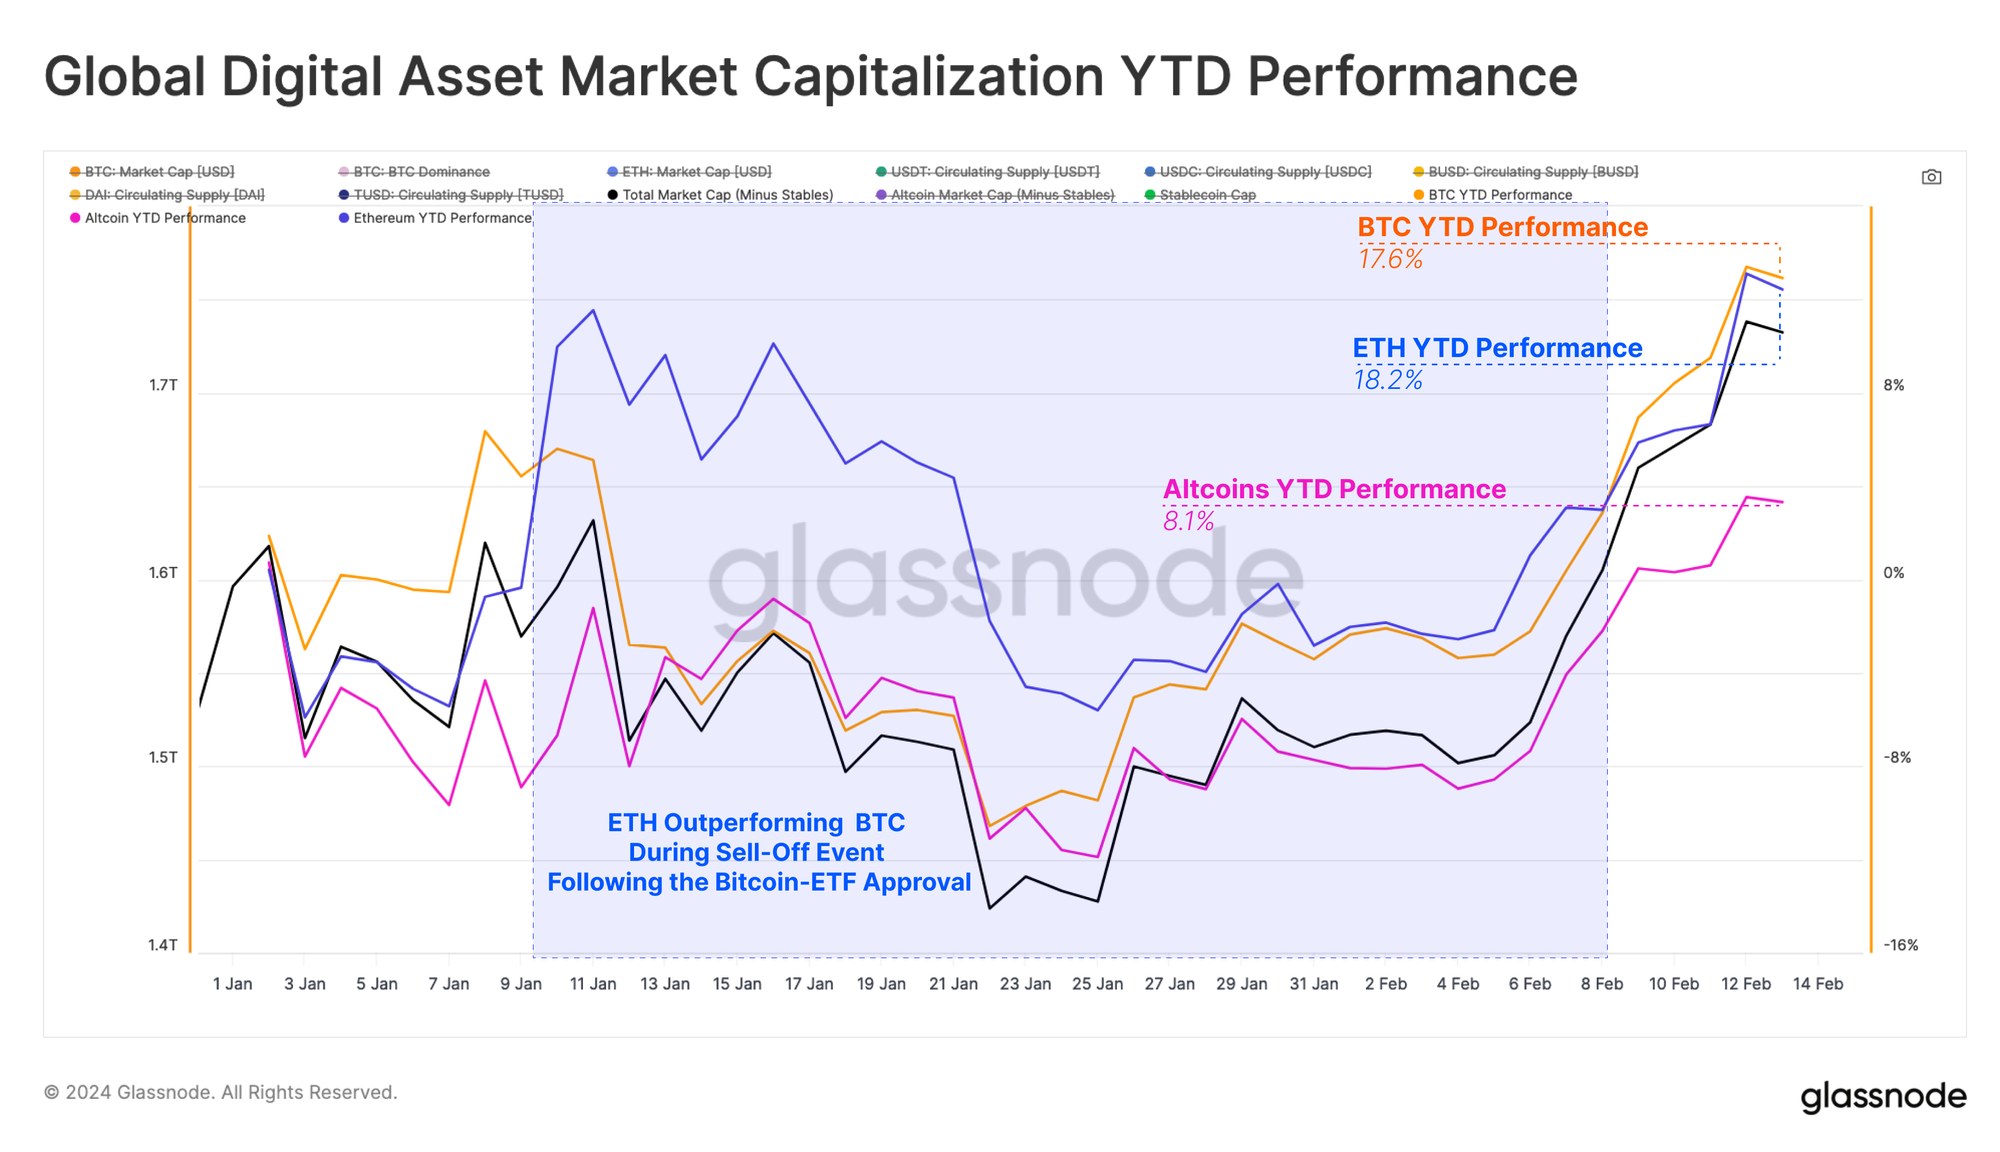
In terms of asset performance, BTC and ETH are leading the pack, with YTD gains of +17.6% and +18.2%, respectively. We note that following the approval of the Bitcoin ETF, ETH has started to outperform BTC, which is a change from the relative underperformance throughout 2023.
On the other hand, the aggregate Altcoin market cap has not experienced the same performance, with YTD growth being less than half of the two majors.
Another lens to track performance is using the Realized Cap for each sector, which aggregates the cost basis value of all coins transferred on-chain. From this perspective we can better assess the movement of capital within digital asset markets:
- Bitcoin is again clearly leading, seeing almost $20B in capital inflows per month at present.
- Ethereum inflows tend to lag relative to Bitcoin, suggesting investors look for confidence and confirmation that digital asset markets are growing. In the 2021 cycle, the peak influx of new capital into BTC occurred 20 days before the peak influx into ETH.
- Altcoins tend to see capital flows with a similar lag after ETH sees strength, with a duration of 46 days in mid-2021, and 14 days in late-2021.
It is evident that capital moves down the risk curve into Altcoins at a slower pace compared to the rotation between the two major cryptocurrencies, a trend which appears to be in play once again.

Sector Rotation
With signs of capital flows into the two majors, the next question is to observe how it flows further out on the risk curve over time. Over the course of the last cycle, several new Layer-1 ecosystems have emerged. Many of these compete with ETH for market share, not only in terms of innovation and user attraction, but also in terms of investor capital.
We therefore examine the top five tokens of some select ecosystems: Ethereum, Cosmos, Polkadot, and Solana, to assess which are attracting the most investor interest.
Here we compare the weekly change in the aggregate market cap of the top five tokens in each ecosystem. Over the past 18-months, Solana has exhibited relatively high volatility, with upside performance being a standout. Polkadot and Cosmos have similar volatility, but with the Polkadot ecosystem outperforming latter.

Within the Ethereum ecosystem, we can specify three major sectors: DeFi, GameFi, and Staking. Since the beginning of this year, all three sectors have seen inflows, however the DeFi and GameFi sectors have seen relatively large capital outflows throughout 2022 and 2023.
This year has seen a reversal in the GameFi sector, with notable inflows starting in October, which coincides with the point when our Altcoin Indicator triggered. In contrast, Staking tokens have consistently experienced positive capital inflows, although less in absolute magnitude.

Out on the Risk-Curve
To determine whether, and to what extent investor interest is shifting out on the risk curve, we can refer to data sourced from Uniswap liquidity pools. Since Altcoins are often traded by more crypto-native traders via decentralized exchanges, activity on the most established DEX can serve as a proxy trends in Altcoin trading (note: this data reflects Uniswap trading on the Ethereum mainnet).
Altcoin trading interest was very low during the 2022 bear market, but has started to increase in mid 2023, driven largely by a bust of ‘Meme-Coin mania’. Currently, Altcoin trading accounts for nearly 12% of Uniswap trade volume, approaching the 17.4% peak seen during the last bull run. In comparison, trading for WBTC and WETH makes up 47% and Stablecoins 40% of trade volume.

Liquidity Providers on Uniswap tend to closely monitor the markets, and changes in the distribution of liquidity across pools can provide an indication for prevailing market trends. By examining the composition of the Total Value Locked (TVL) on Uniswap, we observe that during Altcoin Season, there is increased liquidity profile for tokens outside the Top 50. This trend is indicative of growing investor interest in long-tail tokens.
During bear markets, liquidity is predominantly provided for the Top 50 tokens, as this is where the majority of trade volume occurs. The Top 10 tokens are mainly comprised of WETH, WBTC, and Stablecoins.
By looking at the percent change in TVL for each token category, we can detect an increase in liquidity provided for the Top 10 (5.14%) and Top 20 (10.9%) tokens, whilst liquidity has been removed for tokens ranked ranked 20 to 50. This suggests that the market appetite for long-tail assets has not yet picked up meaningfully.

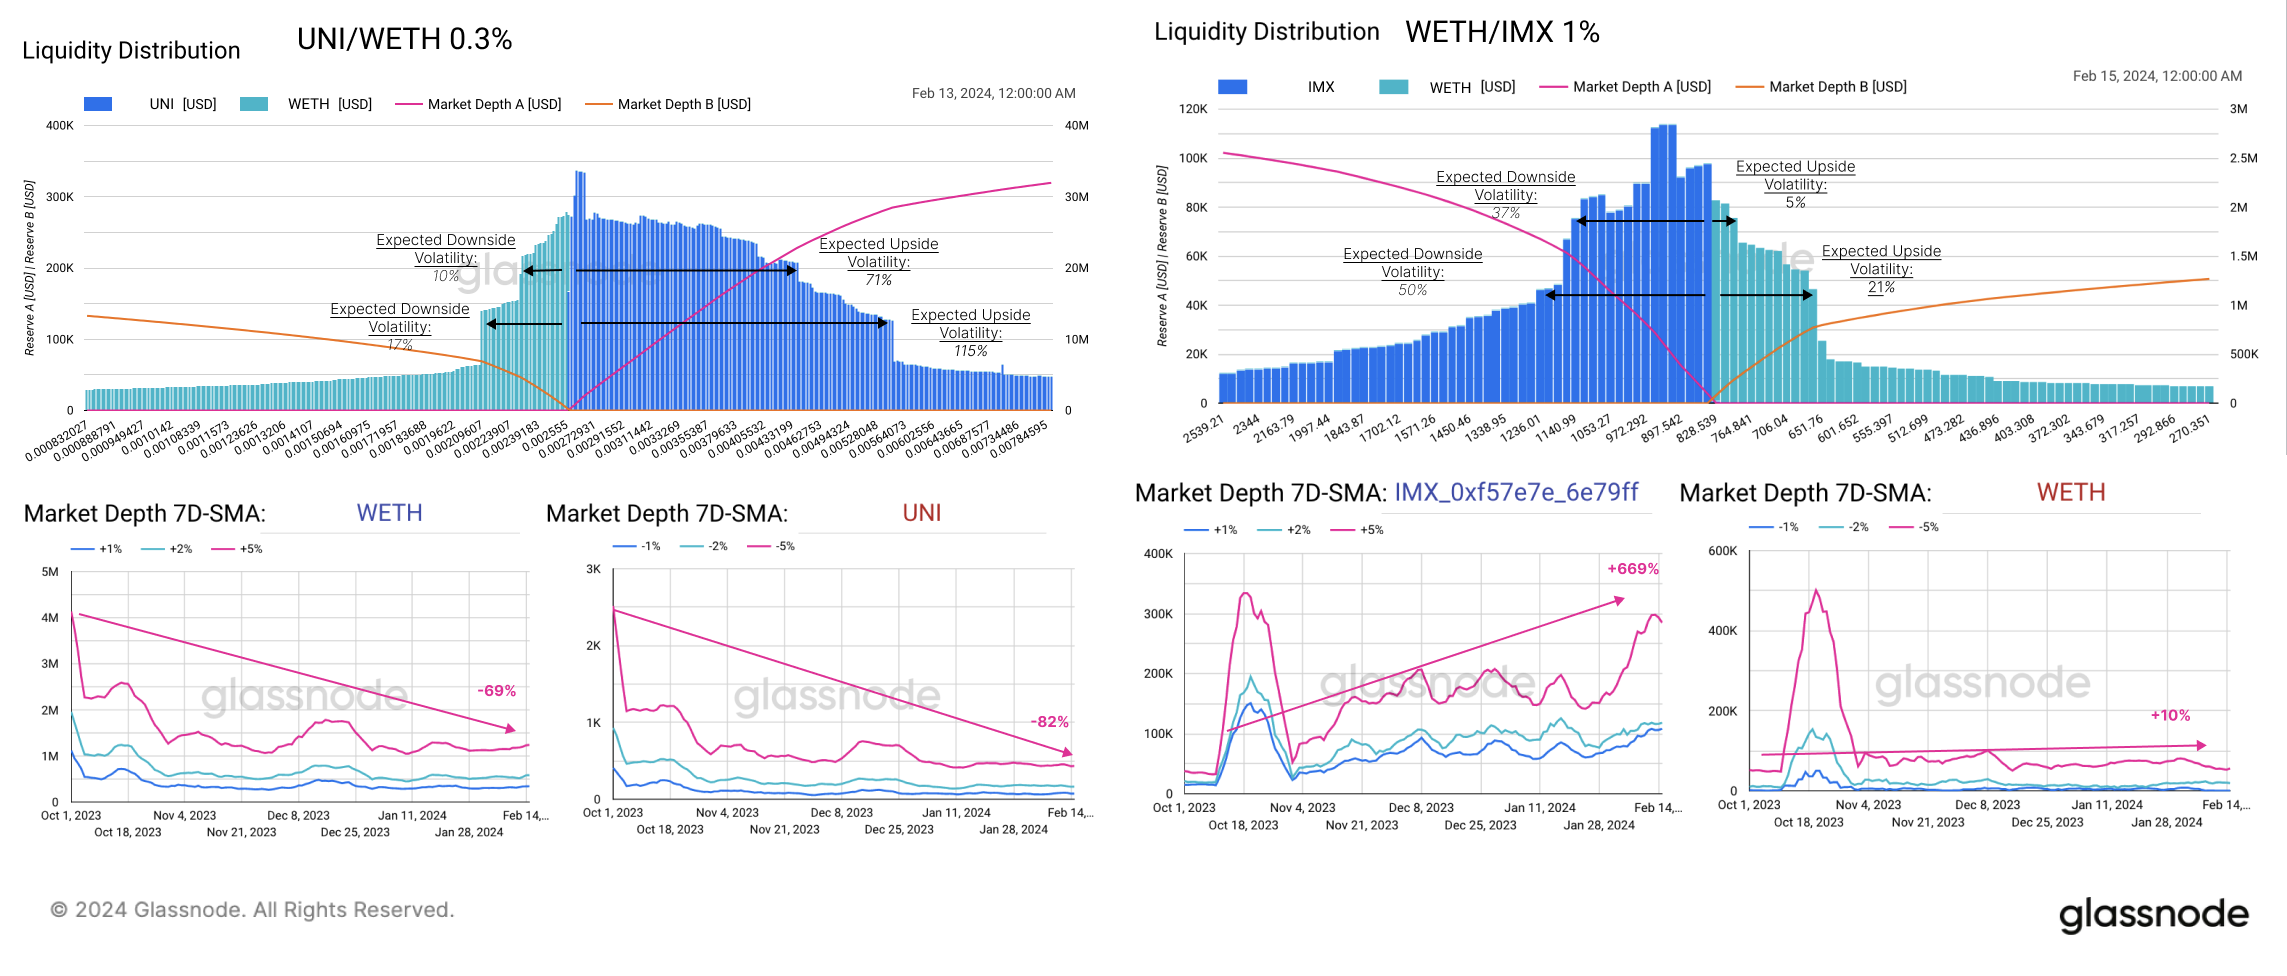
We will now examine the pools for the top token in each Ethereum sector. This includes assessing the distribution of liquidity across various price ranges, and observing the evolution of market depth (similar to our hypothesis established in WoC 36).
The distribution between Altcoin and WETH reserve is well-balanced, with a slightly higher expected upside volatility accross the board. This indicates a generally bullish outlook from Liquidity Providers for these tokens. The exception is the GameFi token IMX.
When observing the rate of change in liquidity distribution, we see an increase in market depth for the -5% and +5% ranges, suggesting that Liquidity Providers are preparing for a period of elevated price volatility.
An exception to this is UNI, where Market Makers have increasingly concentrated liquidity closer to the current price range. This suggests less price volatility is expected for the UNI token, which is not surprising given it is one of the most established and mature tokens.

We now contrast this with the behavior of traders, where we can observe an increase in trading volume on Uniswap since October 2023, including tokens outside the Top 10. Trading activity is also rising for the Top 10 to 20 token pairs.
However, trading activity for the Top 20-50 token pairs and those ranked 50+ remains unchanged, which reaffirms our previous hypothesis: While liquidity provision is moving further out on the risk curve, trade volume has yet to follow.

Summary and Conclusion
The market momentum following the new Bitcoin ETFs, and the anticipation of a bull market in digital assets is starting to create shifts in capital flows towards Altcoins. Our Altcoin Indicator suggests a more mature and possibly sustained uptick in Altcoin markets, however it remains relatively concentrated in higher market cap assets at this time.
The digital asset landscape has evolved significantly over the last cycle, with new ecosystems emerging to challenge Ethereum’s dominance. Solana has seen the strongest returns over the last year, however some movement is starting within the Polkadot and Cosmos ecosystems also. Within the Ethereum ecosystem, the Staking sector is showing the most consistent capital inflow for its top tokens.
A resurgence in Altcoin trading on Uniswap, alongside liquidity and trading volume patterns, underscores a cautious yet growing interest in longer-tail assets. This is initially showing up in changing liquidity provision, and an expectation of heightened volatility. This however is particularly present TVL within the pools, and investor trade volume has yet to follow.
Disclaimer: This report does not provide any investment advice. All data is provided for information and educational purposes only. No investment decision shall be based on the information provided here and you are solely responsible for your own investment decisions.
Exchange balances presented are derived from Glassnode’s comprehensive database of address labels, which are amassed through both officially published exchange information and proprietary clustering algorithms. While we strive to ensure the utmost accuracy in representing exchange balances, it is important to note that these figures might not always encapsulate the entirety of an exchange’s reserves, particularly when exchanges refrain from disclosing their official addresses. We urge users to exercise caution and discretion when utilizing these metrics. Glassnode shall not be held responsible for any discrepancies or potential inaccuracies. Please read our Transparency Notice when using exchange data.

- SEO Powered Content & PR Distribution. Get Amplified Today.
- PlatoData.Network Vertical Generative Ai. Empower Yourself. Access Here.
- PlatoAiStream. Web3 Intelligence. Knowledge Amplified. Access Here.
- PlatoESG. Carbon, CleanTech, Energy, Environment, Solar, Waste Management. Access Here.
- PlatoHealth. Biotech and Clinical Trials Intelligence. Access Here.
- Source: https://insights.glassnode.com/the-week-onchain-week-08-2024/

