
Published 2 hours ago
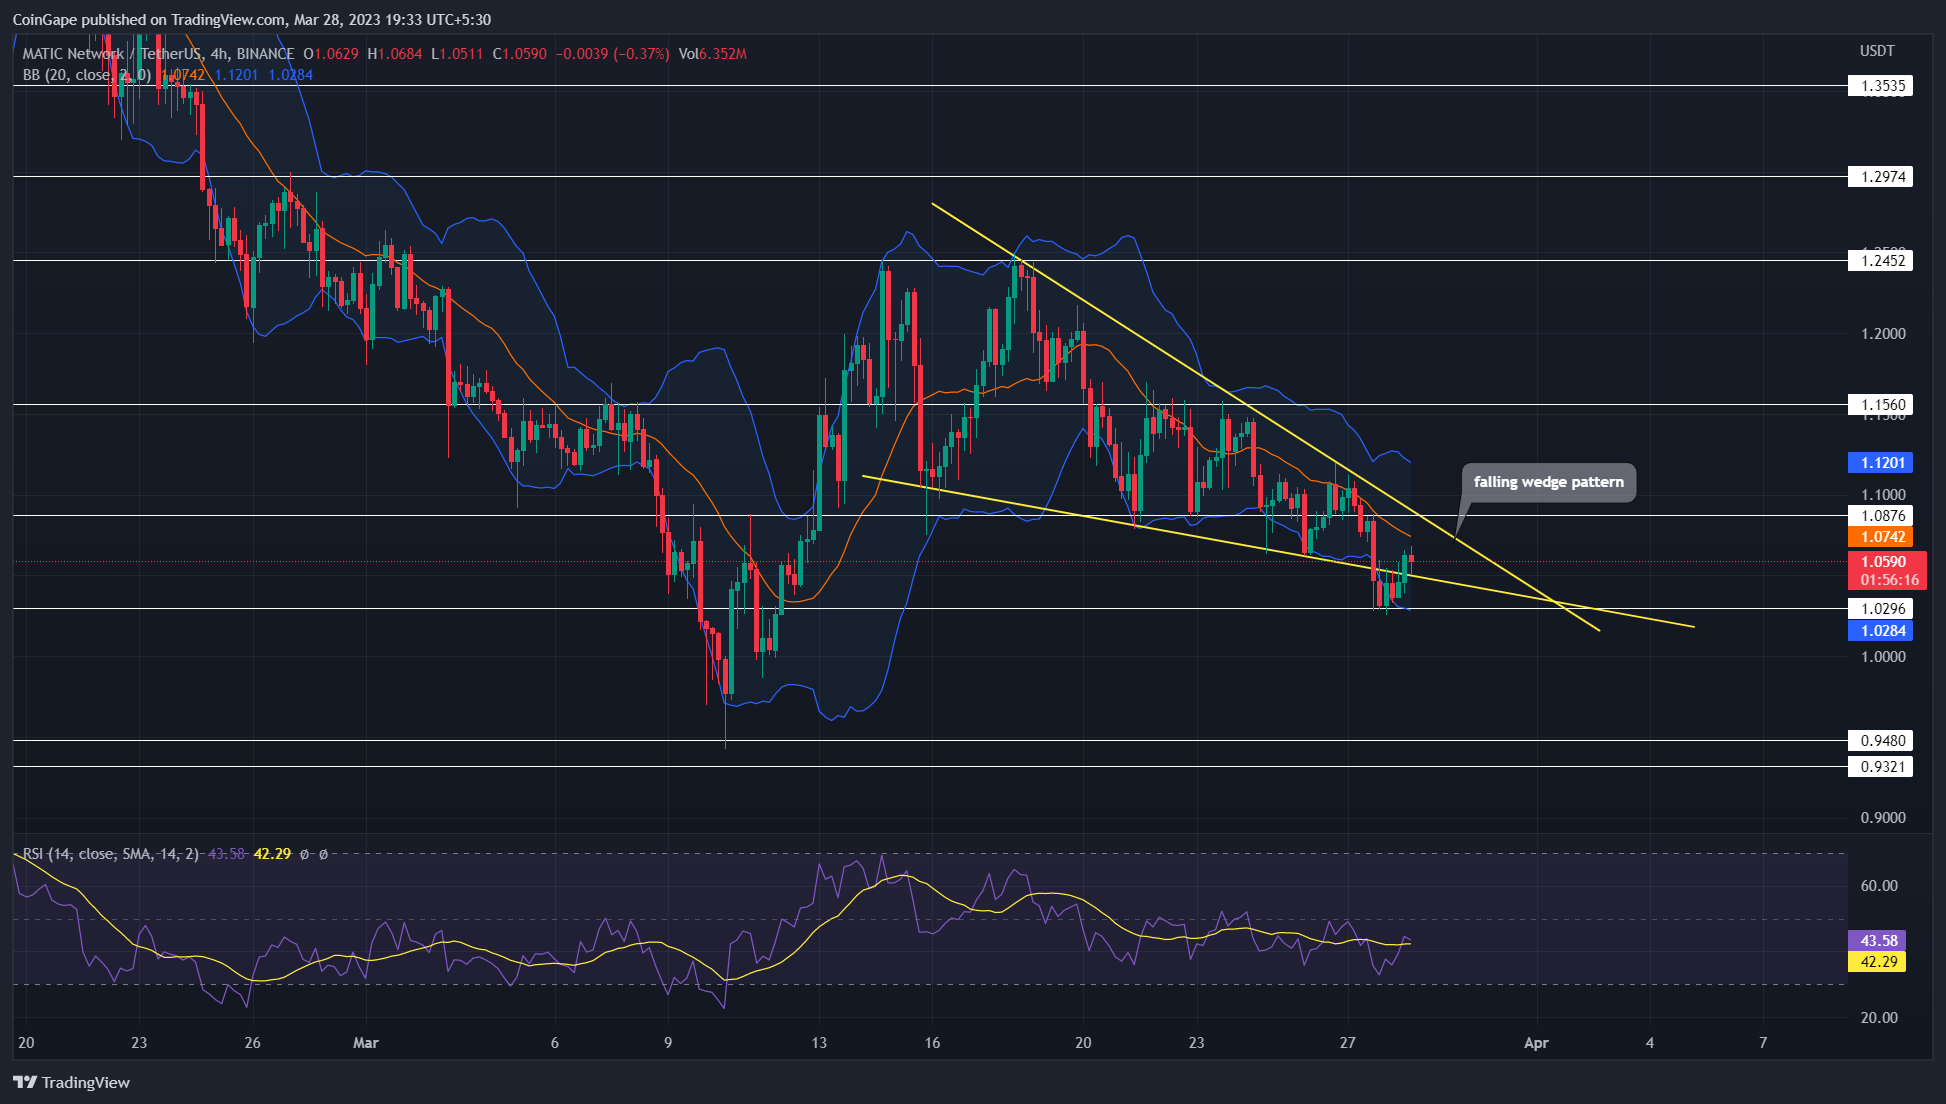
MATIC Price Prediction: Over the last two weeks, the MATIC price witnessed a steady downfall between two converging trendlines. In the 4-hour time frame chart this correction phase is shaped into a famous bullish continuation pattern called a falling wedge. Here’s how this pattern is likely to influence the polygon coin’s future price.
Key Points
- The MATIC price will continue to ongoing correction until the falling wedge pattern is intact
- A potential bullish breakout from the overhead trendline will signal the resumption of the prevailing recovery phase.
- The intraday trading volume in the MATIC is $397 Million, indicating a 31% gain.
Source- -Tradingview
In theory, the asset price falling within converging trendlines indicates a gradual loss of bearish momentum. As the coin price reaches the peak of the wedge pattern, the buyers usually reclaim trend control and breach the overhead trendline to start a bullish rally.
Trending Stories
However, with the increased uncertainty in the crypto market, the MATIC price showcased a fake breakdown from the pattern’s support trendline. On March 27th, the price breached the lower trendline, indicating sellers’ dominance and the possibility of further downfall.
Also Read: Top 6 Liquid Staking Platforms On Ethereum
However, the seller couldn’t sustain lower levels and with today’s 1.5% jump, the MATIC price reclaimed the breached trendline. If the coin shows sustainability above the support trendline and the buyers could drive the price to the overhead trendline.
This bear trap must have caught aggressive short-sellers who may face force liquidation for narrow stop loss and thus increase buying orders in the market.
Anyhow, interested traders looking for an entry opportunity should wait for a bullish breakout from the pattern’s resistance trendline. This potential breakout could raise the polygon coin’s market value to the $1.2 mark.
Technical Indicators
RSI: despite a downtrend in price action, the 4-hour RSI slope moving sideways accentuates losing bearish momentum. This bullish divergence gives additional confirmation for the upcoming bullish breakout.
Bollinger Band: The MATIC price trading below the midline of the Bollinger band indicator reflects the sellers are currently controlling the price trend.
MATIC Coin Price Intraday Levels
- Spot rate: $1.056
- Trend: Bullish
- Volatility: Medium
- Resistance levels- $1.08, and $1.15
- Support levels- $1.03 and $0.94
Share this article on:
advertisement
The presented content may include the personal opinion of the author and is subject to market condition. Do your market research before investing in cryptocurrencies. The author or the publication does not hold any responsibility for your personal financial loss.
<!– Close Story–>
- SEO Powered Content & PR Distribution. Get Amplified Today.
- Platoblockchain. Web3 Metaverse Intelligence. Knowledge Amplified. Access Here.
- Source: https://coingape.com/markets/matic-price-prediction-bear-trap-drives-polygon-coin-price-for-a-potential-18-rally/

