SNEAK PEEK
- Jump Trading’s bullish move sparks LDO market surge.
- LDO’s price soars as bulls dominate and investor confidence rises.
- Technical indicators support LDO’s bullish solid trend.
On August 9, 2022, Jump Trading’s second primary wallet began withdrawing Lido Dao (LDO) from exchanges and withdrew $5.9 million at $2.42 per token, or 2.44 million LDO. Jump Trading’s action suggests they are bullish about the future of LDO. They might soon anticipate a significant price increase, bringing in a profit.
3/ Another main wallet of Jump Trading started to withdraw $LDO from exchanges on August 9, 2022.
And withdrew a total of 2.44M $LDO ($5.9M) at an average price of $2.42.
It seems like market making, and we don’t know his real buying and selling price on exchanges. pic.twitter.com/6S5mmLtLrt
— Lookonchain (@lookonchain) May 18, 2023
As a result, bulls have dominated the LDO market in the past 24 hours, driving prices from an intraday low of $2.16 to an intraday high of 2.53. At the time of writing, LDO was trading at $2.28, a 2.38% increase from the previous closing.
LDO’s market capitalization and 24-hour trading volume increased by 2.38% and 25.92% to $2,004,092,077 and $155,170,200 respectively. This increase is a sign of a positive market trend that suggests investors are growing more confident in the performance of LDO.
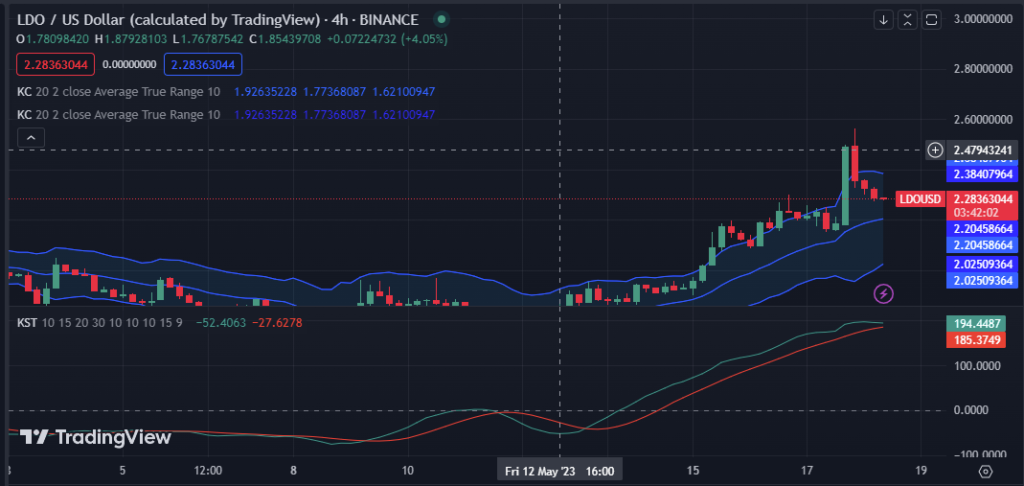
On the LDO’s 4-hour price chart, the Keltner Channel bands are pointing north, indicating a bullish trend, with upper and lower readings of 2.39401798 and 1.99980654, respectively. Traders may consider purchasing LDO at the current levels with a sell target price close to the upper Keltner Channel.
Green candlesticks form as price action moves upward and above the middle band on the LDO price chart, bolstering the bullish momentum. However, traders should be mindful of potential resistance levels and use a stop loss to reduce risk when the bulls’ strength wanes.
With a reading of 194.9651 and a movement above its signal line, the Know Sure Thing (KST) signals that bullish momentum is increasing in the market. Investors may consider selling their long positions or opening new ones if the KST line crosses below the signal line, which may be interpreted as a sell signal.
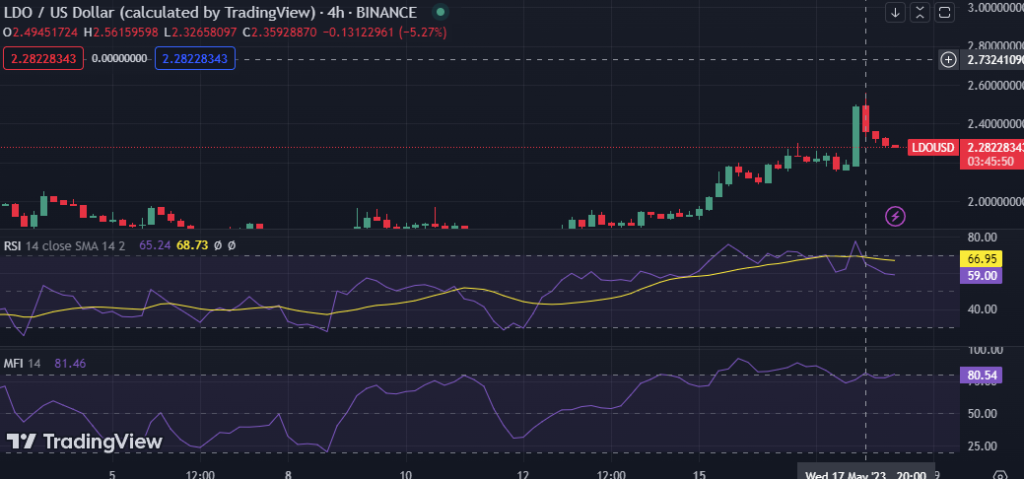
The Relative Strength Index (RSI) reading of 59.00, above the 50-point level, shows more buying pressure than selling pressure and supports the bullish momentum. However, the bullish momentum may wane since the RSI crosses below its signal line, necessitating traders’ establishment of stop losses.
LDO has a solid bullish trend with a Money Flow Index (MFI) rating of 80.54 on the 4-hour price chart, showing buyers are in charge of the market. Until the MFI rating falls below 50, traders may consider holding onto their current long positions or establishing new ones.
In conclusion, LDO’s bullish surge, backed by Jump Trading’s actions, signals a confident market. Traders should capitalize on upward momentum while monitoring potential resistance levels.
Disclaimer: Cryptocurrency price is highly speculative and volatile and should not be considered financial advice. Past and current performance is not indicative of future results. Always research and consult with a financial advisor before making investment decisions.
- SEO Powered Content & PR Distribution. Get Amplified Today.
- PlatoAiStream. Web3 Data Intelligence. Knowledge Amplified. Access Here.
- Minting the Future w Adryenn Ashley. Access Here.
- Buy and Sell Shares in PRE-IPO Companies with PREIPO®. Access Here.
- Source: https://investorbites.com/lido-dao-price-analysis-05-18/

