The formation of a wedge pattern could bolster ETH price to rebound from $1500 and prolong a recovery trend; should you enter long?
<!–
–>
Published 7 hours ago
In the face of escalating selling pressure throughout the altcoin sector, the ETH price trajectory experienced a pronounced decline, pulling back sharply from its resistance near the $1745 mark. This dip which occurred over a mere fortnight recorded a 10.5% loss and wiped out the entire gain of September. Could this mounting bearish pressure drive Ether below the $1500 threshold?
advertisement
<!–
adClient.showBannerAd({
adUnitId: “856eec25-5bac-4623-9cc6-5827ff47c238”, containerId: “market-banner-ad-mobile”
});
–>
Also Read: 10 Largest Ethereum Wallets Hold With Diamond Hands Despite ETH Exchange Inflows
Will ETH Price Rebound from $1500?
- The ETH price could witness high demand pressure at $1500
- The Ethereum fear and greed index at 42% reflects neutral to bearish sentiment in the market.
- The intraday trading volume in Ether is $5.3 Billion, indicating a 0.8% gain.
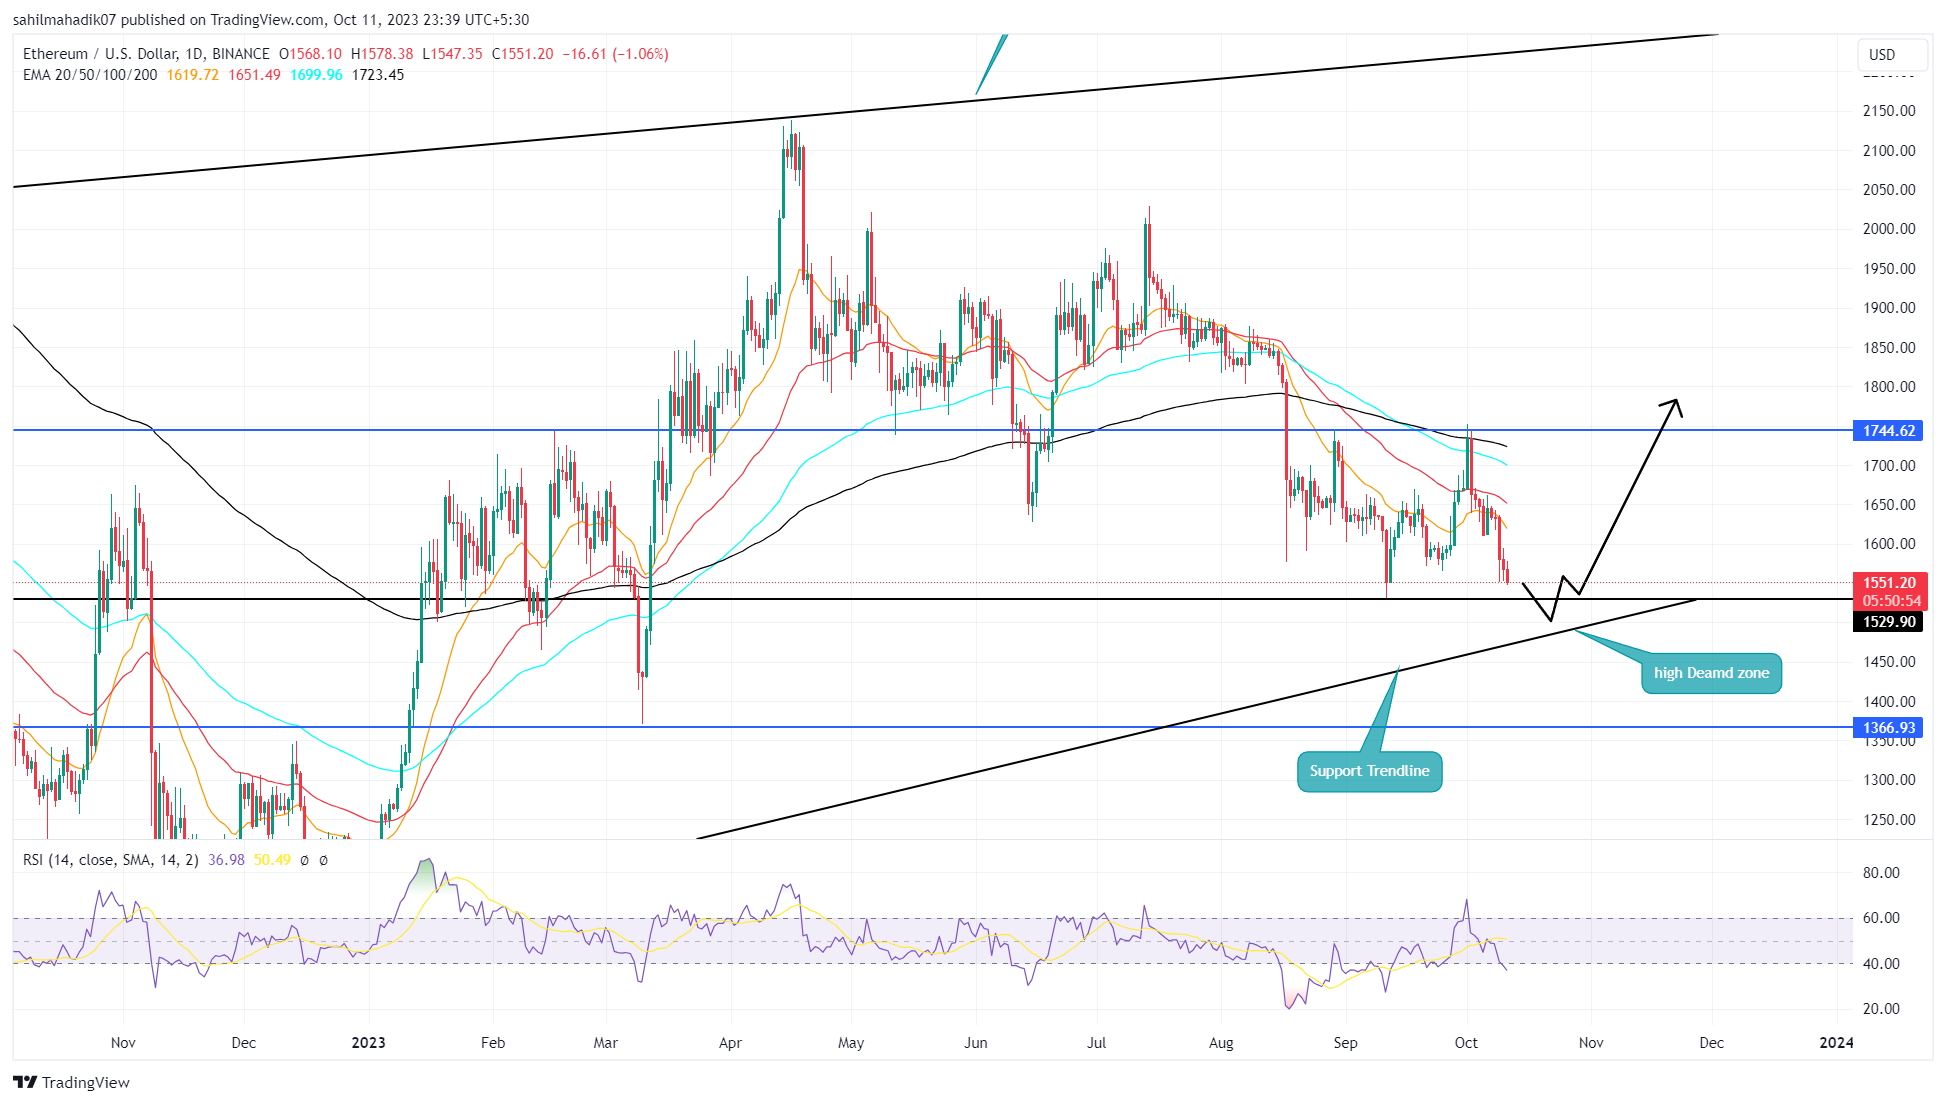
Source- Tradingview
Currently, the Ethereum price is trading at $1,556, reflecting a 0.73% dip within the day. Should this downward momentum continue, this altcoin could further descend by approximately 3%, targeting the confluence of the $1,500 level and a longstanding support trendline that delineates a rising wedge pattern.
This particular support has its origins dating back to June 2022 and has consistently served as a pivotal accumulation point during a major market retracement. Hence, as the ETH price approaches this crucial juncture, it’s plausible to expect a resurgence in buying interest around the $1,500 mark.
If the coin price manages to firmly anchor above this level, the bullish traders might seize this opportunity to catalyze a recovery. In alignment with the structure of the rising wedge pattern, a bullish pivot from this support is anticipated to propel the ETH price toward the pattern’s upper trendline.
In an optimistic scenario, the altcoin might undergo a substantial rally, potentially breaching the year-high $2,238.
ETH vs BTC Performance
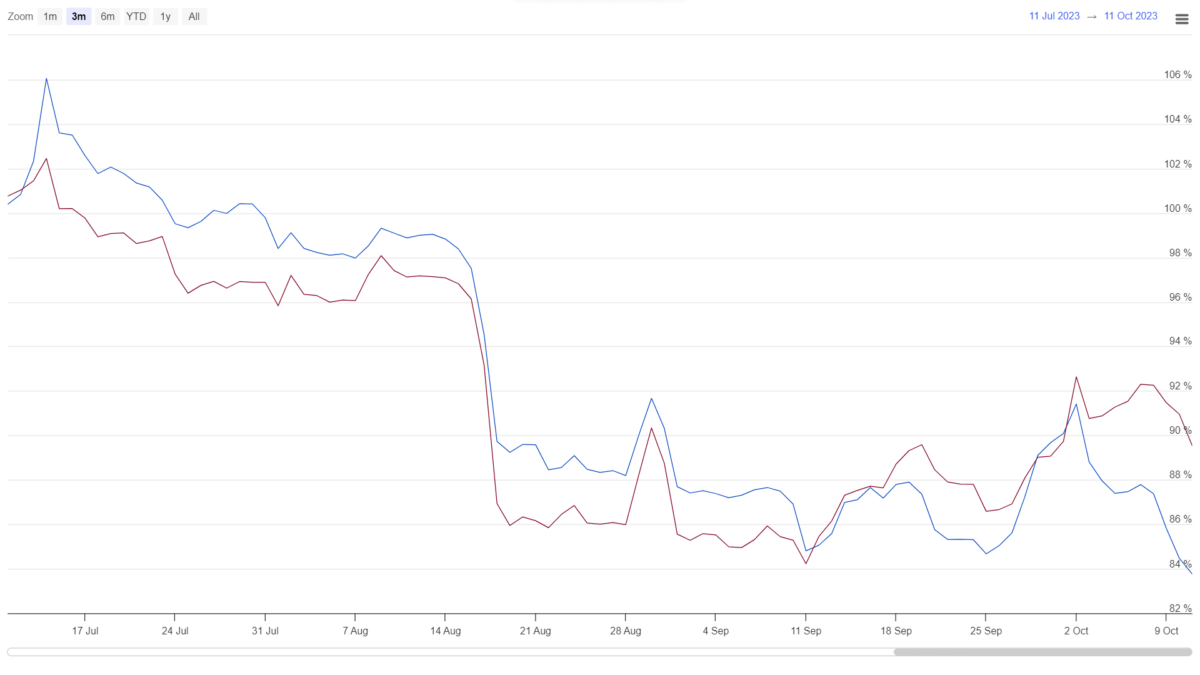
Source: Coingape| Ethereum Vs Bitcoin Price
A comparison analysis of the past couple of months reveals that the Ethereum coin has lagged behind the leading cryptocurrency Bitcoin in terms of performance. Since mid-September, Bitcoin price embarked on a new relief rally, whereas the ETH price demonstrated a more horizontal price movement. In addition, this altcoin has witnessed a steep correction with the recent downturn.
advertisement
The presented content may include the personal opinion of the author and is subject to market condition. Do your market research before investing in cryptocurrencies. The author or the publication does not hold any responsibility for your personal financial loss.
<!– Close Story–>
- SEO Powered Content & PR Distribution. Get Amplified Today.
- PlatoData.Network Vertical Generative Ai. Empower Yourself. Access Here.
- PlatoAiStream. Web3 Intelligence. Knowledge Amplified. Access Here.
- PlatoESG. Carbon, CleanTech, Energy, Environment, Solar, Waste Management. Access Here.
- PlatoHealth. Biotech and Clinical Trials Intelligence. Access Here.
- Source: https://coingape.com/markets/key-levels-to-watch-as-eth-price-revisit-multi-month-support/

