In their own words, “In 1902, Willis Carrier solved one of mankind’s most elusive challenges of controlling the indoor environment through modern air conditioning. Today, Carrier products create comfortable environments, safeguard the global food supply, and enable safe transport of vital medical supplies under exacting conditions.”
At Carrier, the foundation of our success is making products our customers can trust to keep them comfortable and safe year-round. High reliability and low equipment downtime are increasingly important as extreme temperatures become more common due to climate change. We have historically relied on threshold-based systems that alert us to abnormal equipment behavior, using parameters defined by our engineering team. Although such systems are effective, they are intended to identify and diagnose equipment issues rather than predict them. Predicting faults before they occur allows our HVAC dealers to proactively address issues and improve the customer experience.
In order to improve our equipment reliability, we partnered with the Amazon Machine Learning Solutions Lab to develop a custom machine learning (ML) model capable of predicting equipment issues prior to failure. Our teams developed a framework for processing over 50 TB of historical sensor data and predicting faults with 91% precision. We can now notify dealers of impending equipment failure, so that they can schedule inspections and minimize unit downtime. The solution framework is scalable as more equipment is installed and can be reused for a variety of downstream modeling tasks.
In this post, we show how the Carrier and AWS teams applied ML to predict faults across large fleets of equipment using a single model. We first highlight how we use AWS Glue for highly parallel data processing. We then discuss how Amazon SageMaker helps us with feature engineering and building a scalable supervised deep learning model.
Overview of use case, goals, and risks
The main goal of this project is to reduce downtime by predicting impending equipment failures and notifying dealers. This allows dealers to schedule maintenance proactively and provide exceptional customer service. We faced three primary challenges when working on this solution:
- Data scalability – Data processing and feature extraction needs to scale across large growing historical sensor data
- Model scalability – The modeling approach needs to be capable of scaling across over 10,000 units
- Model precision – Low false positive rates are needed to avoid unnecessary maintenance inspections
Scalability, both from a data and modeling perspective, is a key requirement for this solution. We have over 50 TB of historical equipment data and expect this data to grow quickly as more HVAC units are connected to the cloud. Data processing and model inference need to scale as our data grows. In order for our modeling approach to scale across over 10,000 units, we need a model that can learn from a fleet of equipment rather than relying on anomalous readings for a single unit. This will allow for generalization across units and reduce the cost of inference by hosting a single model.
The other concern for this use case is triggering false alarms. This means that a dealer or technician will go on-site to inspect the customer’s equipment and find everything to be operating appropriately. The solution requires a high precision model to ensure that when a dealer is alerted, the equipment is likely to fail. This helps earn the trust of dealers, technicians, and homeowners alike, and reduces the costs associated with unnecessary on-site inspections.
We partnered with the AI/ML experts at the Amazon ML Solutions Lab for a 14-week development effort. In the end, our solution includes two primary components. The first is a data processing module built with AWS Glue that summarizes equipment behavior and reduces the size of our training data for efficient downstream processing. The second is a model training interface managed through SageMaker, which allows us to train, tune, and evaluate our model before it is deployed to a production endpoint.
Data processing
Each HVAC unit we install generates data from 90 different sensors with readings for RPMs, temperature, and pressures throughout the system. This amounts to roughly 8 million data points generated per unit per day, with tens of thousands of units installed. As more HVAC systems are connected to the cloud, we anticipate the volume of data to grow quickly, making it critical for us to manage its size and complexity for use in downstream tasks. The length of the sensor data history also presents a modeling challenge. A unit may start displaying signs of impending failure months before a fault is actually triggered. This creates a significant lag between the predictive signal and the actual failure. A method for compressing the length of the input data becomes critical for ML modeling.
To address the size and complexity of the sensor data, we compress it into cycle features as shown in Figure 1. This dramatically reduces the size of data while capturing features that characterize the equipment’s behavior.
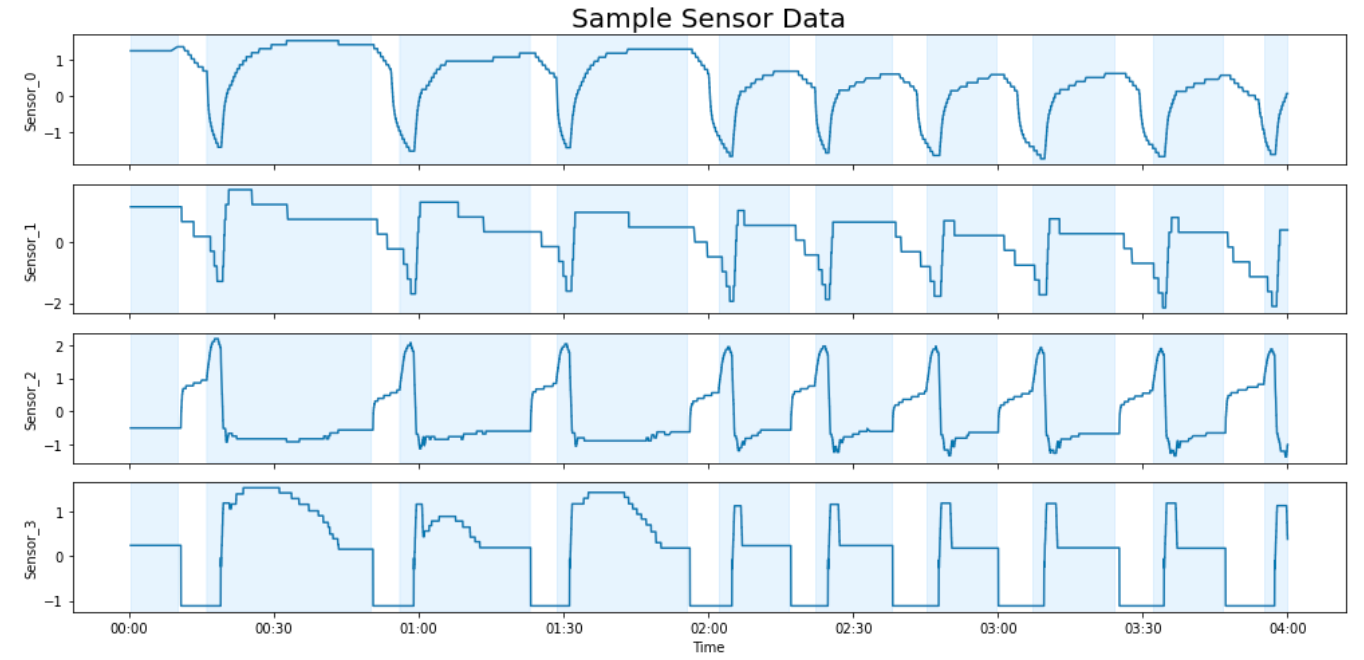
Figure 1: Sample of HVAC sensor data
AWS Glue is a serverless data integration service for processing large quantities of data at scale. AWS Glue allowed us to easily run parallel data preprocessing and feature extraction. We used AWS Glue to detect cycles and summarize unit behavior using key features identified by our engineering team. This dramatically reduced the size of our dataset from over 8 million data points per day per unit down to roughly 1,200. Crucially, this approach preserves predictive information about unit behavior with a much smaller data footprint.
The output of the AWS Glue job is a summary of unit behavior for each cycle. We then use an Amazon SageMaker Processing job to calculate features across cycles and label our data. We formulate the ML problem as a binary classification task with a goal of predicting equipment faults in the next 60 days. This allows our dealer network to address potential equipment failures in a timely manner. It’s important to note that not all units fail within 60 days. A unit experiencing slow performance degradation could take more time to fail. We address this during the model evaluation step. We focused our modeling on summertime because those months are when most HVAC systems in the US are in consistent operation and under more extreme conditions.
Modeling
Transformer architectures have become the state-of-the-art approach for handling temporal data. They can use long sequences of historical data at each time step without suffering from vanishing gradients. The input to our model at a given point in time is composed of the features for the previous 128 equipment cycles, which is roughly one week of unit operation. This is processed by a three-layer encoder whose output is averaged and fed into a multi-layered perceptron (MLP) classifier. The MLP classifier is composed of three linear layers with ReLU activation functions and a final layer with LogSoftMax activation. We use weighted negative log-likelihood loss with a different weight on the positive class for our loss function. This biases our model towards high precision and avoids costly false alarms. It also incorporates our business objectives directly into the model training process. Figure 2 illustrates the transformer architecture.
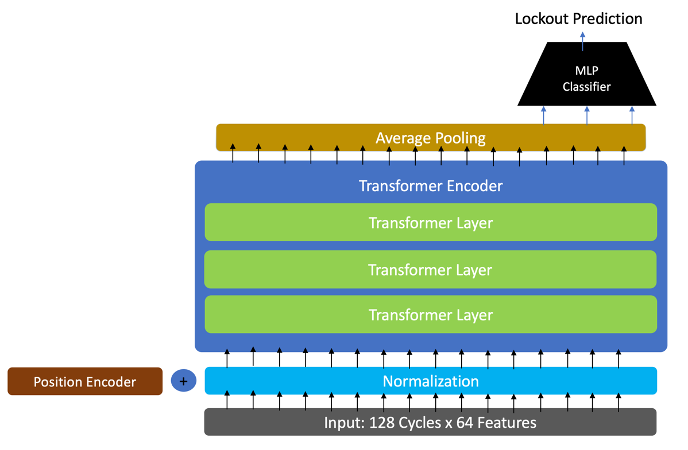
Figure 2: Temporal transformer architecture
Training
One challenge when training this temporal learning model is data imbalance. Some units have a longer operational history than others and therefore have more cycles in our dataset. Because they are overrepresented in the dataset, these units will have more influence on our model. We solve this by randomly sampling 100 cycles in a unit’s history where we assess the probability of a failure at that time. This ensures that each unit is equally represented during the training process. While removing the imbalanced data problem, this approach has the added benefit of replicating a batch processing approach that will be used in production. This sampling approach was applied to the training, validation, and test sets.
Training was performed using a GPU-accelerated instance on SageMaker. Monitoring the loss shows that it achieves the best results after 180 training epochs as show in Figure 3. Figure 4 shows that the area under the ROC curve for the resulting temporal classification model is 81%.
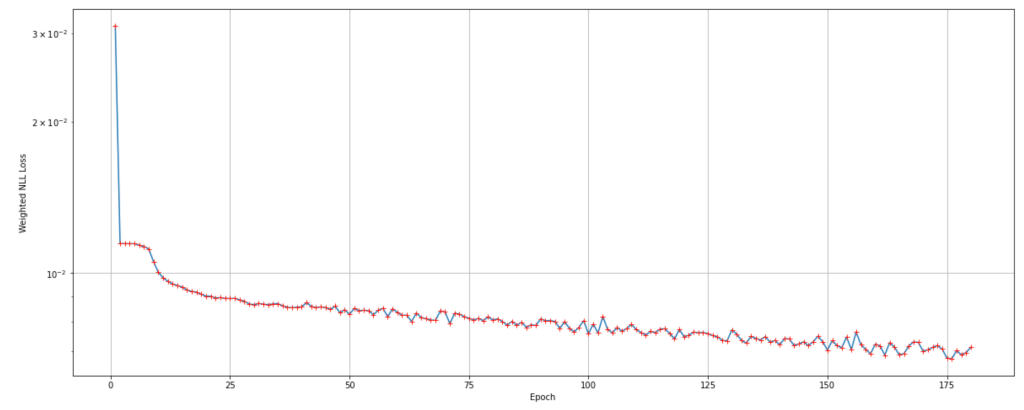
Figure 3: Training loss over epochs |

Figure 4: ROC-AUC for 60-day lockout |
Evaluation
While our model is trained at the cycle level, evaluation needs to take place at the unit level. In this way, one unit with multiple true positive detections is still only counted as a single true positive at the unit level. To do this, we analyze the overlap between the predicted outcomes and the 60-day window preceding a fault. This is illustrated in the following figure, which shows four cases of predicting outcomes:
- True negative – All the prediction results are negative (purple) (Figure 5)
- False positive – The positive predictions are false alarms (Figure 6)
- False negative – Although the predictions are all negative, the actual labels could be positive (green) (Figure 7)
- True positive – Some of the predictions could be negative (green), and at least one prediction is positive (yellow) (Figure 8)
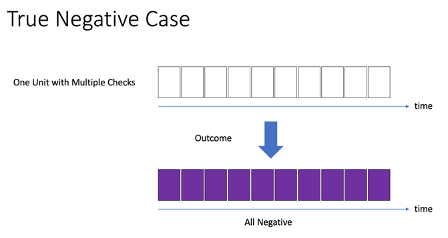
Figure 5.1: True negative case |
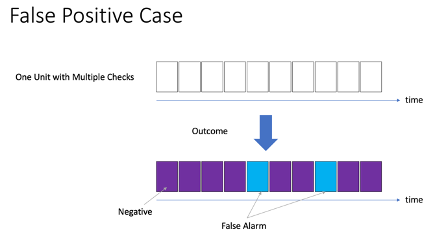
Figure 5.2: False positive case |
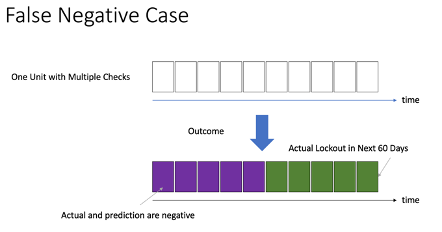
Figure 5.3: False negative case |
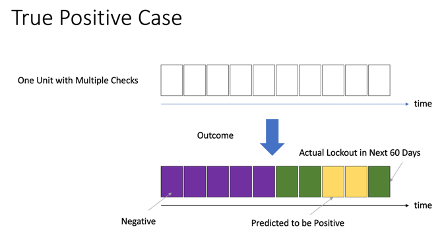
Figure 5.4: True positive case |
After training, we use the evaluation set to tune the threshold for sending an alert. Setting the model confidence threshold at 0.99 yields a precision of roughly 81%. This falls short of our initial 90% criterion for success. However, we found that a good portion of units failed just outside the 60-day evaluation window. This makes sense, because a unit may actively display faulty behavior but take longer than 60 days to fail. To handle this, we defined a metric called effective precision, which is a combination of the true positive precision (81%) with the added precision of lockouts that occurred in the 30 days beyond our target 60-day window.
For an HVAC dealer, what is most important is that an onsite inspection helps prevent future HVAC issues for the customer. Using this model, we estimate that 81.2% of the time the inspection will prevent a lockout from occurring in the next 60 days. Additionally, 10.4% of the time the lockout would have occurred in within 90 days of inspection. The remaining 8.4% will be a false alarm. The effective precision of the trained model is 91.6%.
Conclusion
In this post, we showed how our team used AWS Glue and SageMaker to create a scalable supervised learning solution for predictive maintenance. Our model is capable of capturing trends across long-term histories of sensor data and accurately detecting hundreds of equipment failures weeks in advance. Predicting faults in advance will reduce curb-to-curb time, allowing our dealers to provide more timely technical assistance and improving the overall customer experience. The impacts of this approach will grow over time as more cloud-connected HVAC units are installed every year.
Our next step is to integrate these insights into the upcoming release of Carrier’s Connected Dealer Portal. The portal combines these predictive alerts with other insights we derive from our AWS-based data lake in order to give our dealers more clarity into equipment health across their entire client base. We will continue to improve our model by integrating data from additional sources and extracting more advanced features from our sensor data. The methods employed in this project provide a strong foundation for our team to start answering other key questions that can help us reduce warranty claims and improve equipment efficiency in the field.
If you’d like help accelerating the use of ML in your products and services, please contact the Amazon ML Solutions Lab. To learn more about the services used in this project, refer to the AWS Glue Developer Guide and the Amazon SageMaker Developer Guide.
About the Authors
 Ravi Patankar is a technical leader for IoT related analytics at Carrier’s Residential HVAC Unit. He formulates analytics problems related to diagnostics and prognostics and provides direction for ML/deep learning-based analytics solutions and architecture.
 Dan Volk is a Data Scientist at the AWS Generative AI Innovation Center. He has ten years of experience in machine learning, deep learning and time-series analysis and holds a Master’s in Data Science from UC Berkeley. He is passionate about transforming complex business challenges into opportunities by leveraging cutting-edge AI technologies.
 Yingwei Yu is an Applied Scientist at AWS Generative AI Innovation Center. He has experience working with several organizations across industries on various proof-of-concepts in machine learning, including NLP, time-series analysis, and generative AI technologies. Yingwei received his PhD in computer science from Texas A&M University.
 Yanxiang Yu is an Applied Scientist at Amazon Web Services, working on the Generative AI Innovation Center. With over 8 years of experience building AI and machine learning models for industrial applications, he specializes in generative AI, computer vision, and time series modeling. His work focuses on finding innovative ways to apply advanced generative techniques to real-world problems.
 Diego Socolinsky is a Senior Applied Science Manager with the AWS Generative AI Innovation Center, where he leads the delivery team for the Eastern US and Latin America regions. He has over twenty years of experience in machine learning and computer vision, and holds a PhD degree in mathematics from The Johns Hopkins University.
 Kexin Ding is a fifth-year Ph.D. candidate in computer science at UNC-Charlotte. Her research focuses on applying deep learning methods for analyzing multi-modal data, including medical image and genomics sequencing data.
- SEO Powered Content & PR Distribution. Get Amplified Today.
- PlatoData.Network Vertical Generative Ai. Empower Yourself. Access Here.
- PlatoAiStream. Web3 Intelligence. Knowledge Amplified. Access Here.
- PlatoESG. Automotive / EVs, Carbon, CleanTech, Energy, Environment, Solar, Waste Management. Access Here.
- PlatoHealth. Biotech and Clinical Trials Intelligence. Access Here.
- ChartPrime. Elevate your Trading Game with ChartPrime. Access Here.
- BlockOffsets. Modernizing Environmental Offset Ownership. Access Here.
- Source: https://aws.amazon.com/blogs/machine-learning/how-carrier-predicts-hvac-faults-using-aws-glue-and-amazon-sagemaker/

