
Published 9 hours ago
Amid the recent consolidation phase in the crypto market, the falling MANA price found support at the $0.29-$0.2975 mark. While market participants remain uncertain, the price action walked sideways and created a narrow range between the mentioned support and $0.357 resistance. Thus, It has been three weeks since this meta coin has been trapped within the range and has limited the growth potential. However, the daily technical chart reveals this consolidation as the formation of a famous bullish reversal pattern candle double bottom.
advertisement
Key points:
- Under the influence of a bullish pattern, the MANA price is set for a 20% upswing
- The possible rejection from the $0.356 resistance will undermine the bullish thesis.
- The 24-hour trading volume in the Decentraland token is $116,6 Million, indicating a 207.99% gain.
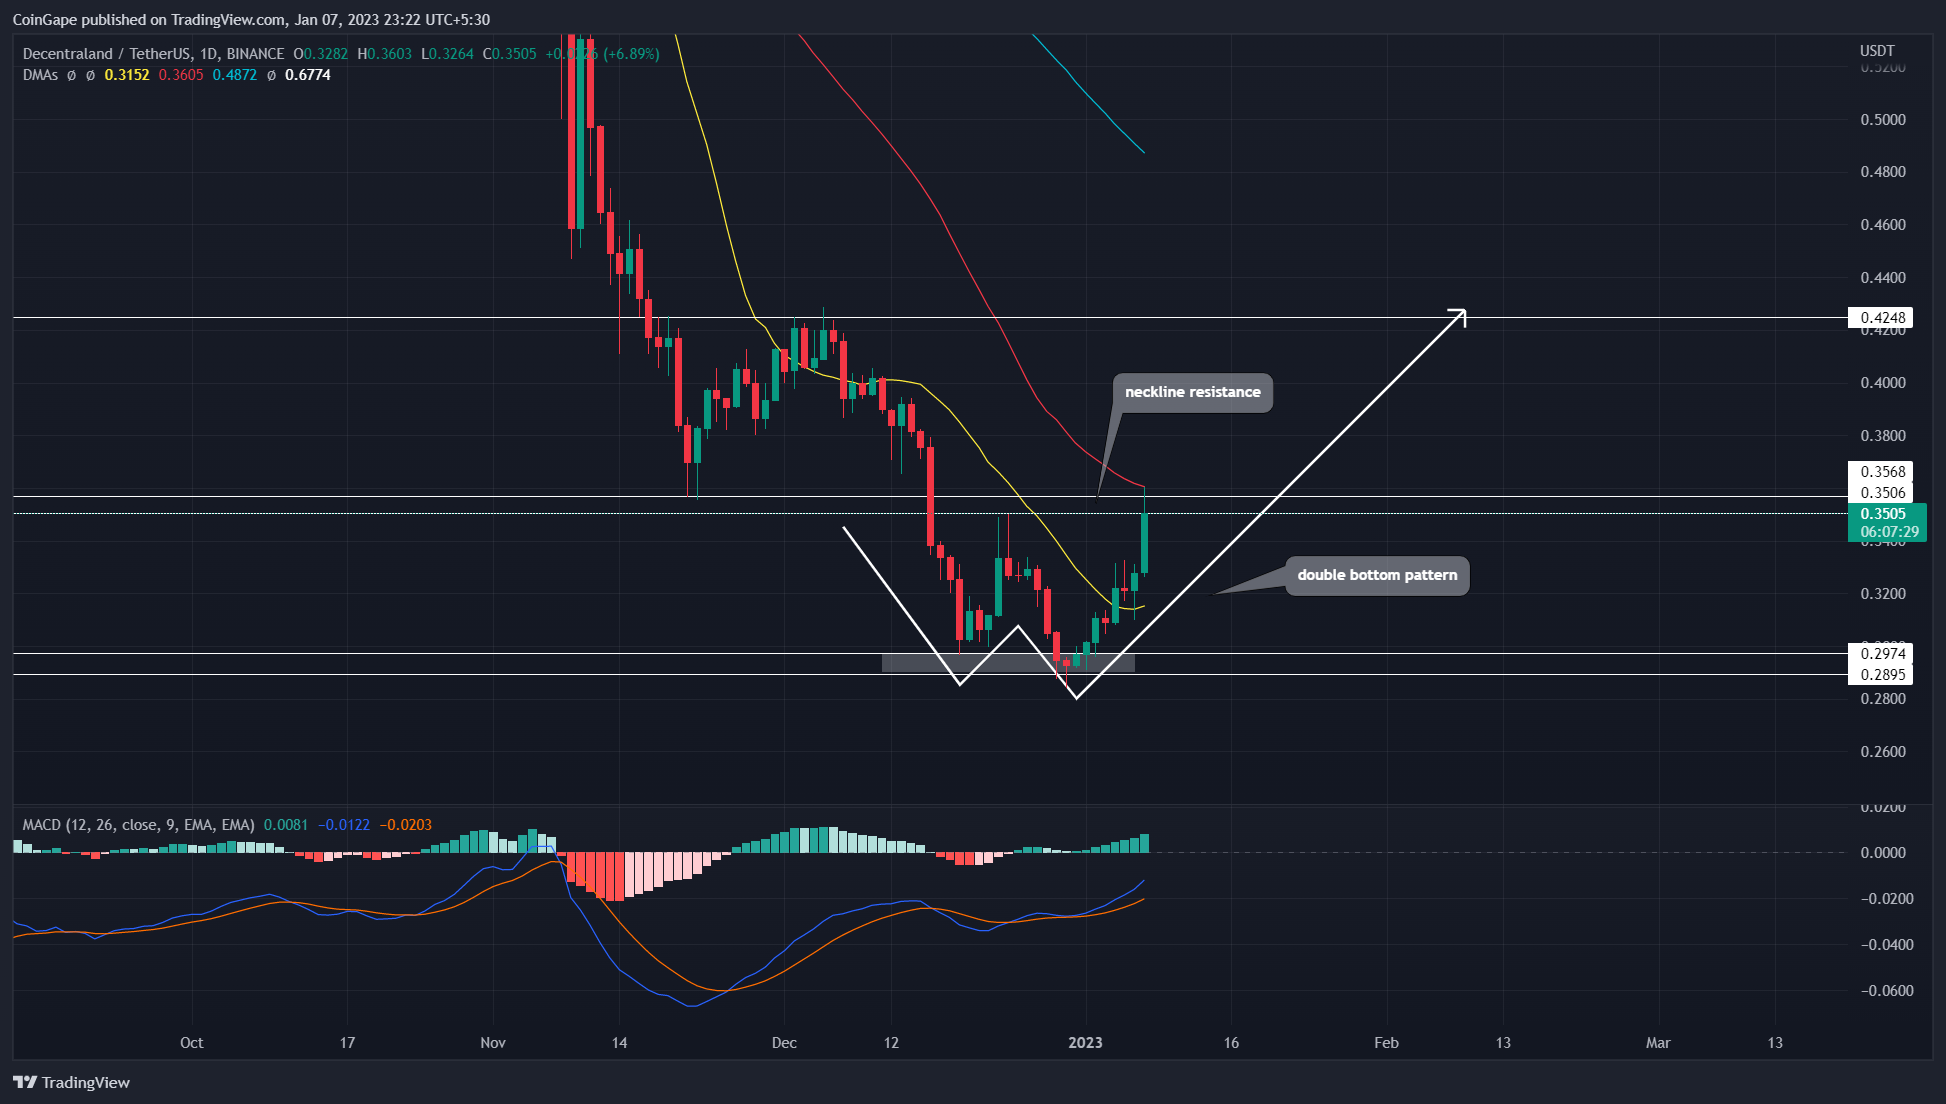
Source-Tradingview
The double bottom pattern is easily identified as it is shaped into a ‘W’ letter design. During the pattern formation, the price rebounded twice more fixed horizontal support twice, indicating price sustainability above base support.
Thus, with the recent recovery in the crypto market, the MANA price rebounded from the $0.29-$0.2975 support on December 31st and surged 20% higher to hit $0.356 resistance. This barrier is also the neckline of this pattern, whose breakout will encourage further growth in MANA tokens.
Trending Stories
Also Read: Explained: What is Physical NFT? and How to Sell Physical Items as NFT
By the press time, the MANA price trades at the $0.352 mark and shows a 7.5% intraday jump. This bullish candle tries to break the neckline resistance of $0.356 to trigger the bullish reversal pattern.
Thus, a daily candle closing above the mentioned will accelerate the buying pressure and offer long entry opportunities for traders. This breakout could soar the MANA price 20% higher to hit the local resistance of $0.425.
However, if the prices can’t sustain above the $0.356 mark, the price consolidation will extend for a few more trading sessions.
Technical indicator
Moving average convergence/divergence: The MACD line(blue) crossing above the signal line(orange) gives a buy signal for the market participant. Moreover, the increasing gap between these slopes indicates sustained buying in the market.
advertisement
DMAs: the 50 DMA is moving near the $0.356 mark, making this resistance even tougher to break out.
MANA Coin Price Intraday Levels
- Spot rate: $0.35
- Trend: Bullish
- Volatility: Low
- Resistance level- $0.35 and $0.425
- Support level- $0.297 and $0.23
Share this article on:
The presented content may include the personal opinion of the author and is subject to market condition. Do your market research before investing in cryptocurrencies. The author or the publication does not hold any responsibility for your personal financial loss.
- SEO Powered Content & PR Distribution. Get Amplified Today.
- Platoblockchain. Web3 Metaverse Intelligence. Knowledge Amplified. Access Here.
- Source: https://coingape.com/markets/heres-why-rising-mana-price-may-witness-20-upswing-in-coming-weeks/

