Published 1 hour ago
The LUNC crypto price showcases a textbook example of ascending triangle pattern in the daily time frame chart. The coin price has tested this pattern’s barrier multiple times, indicating the traders are strictly following this pattern. Thus, with a potential bullish breakout from the $0.0000185 neckline resistance, the prices are well likely to reach their predetermined target of this triangle pattern. Here’s how you can trade this pattern
advertisement
Key Points:
- The LUNC crypto price has entered a no-trading zone within the triangle pattern.
- A bullish crossover between the 20-and-50 EMA encourages the resumption of recovery.
- The intraday trading volume in the LUNC coin is $105 Million, indicating a 65% gain.
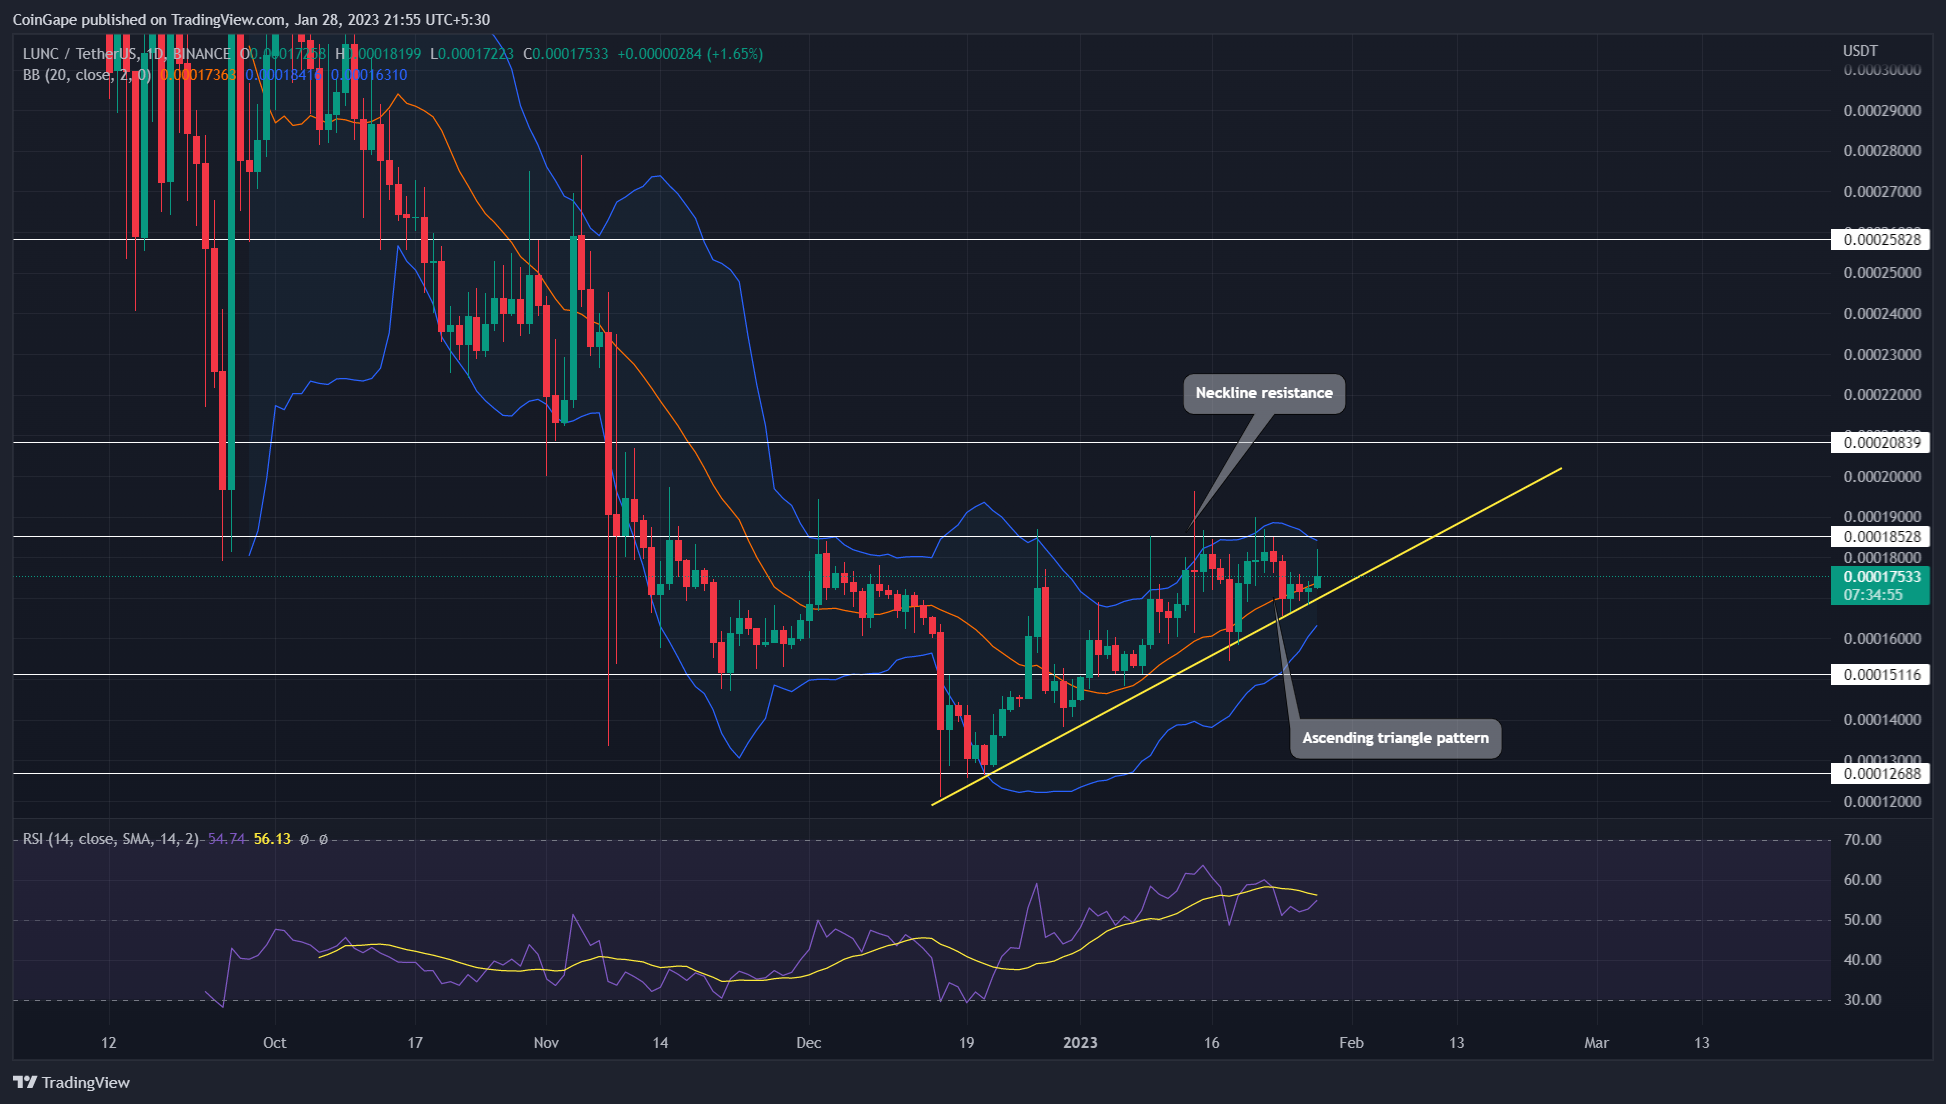
Source- Tradingview
In theory, the emergence of an ascending triangle pattern is a sign of gradual growth in underline bullish momentum. During the pattern formation, the coin price shows a series of higher lows supported by a rising trendline.
Thus, this support trendline should bolster the buyers to breach the pattern’s neckline resistance and trigger a directional rally. By the press time, the LUNC crypto price trades at $0.00017 and continues to wobble between the rising trendline and $0.000185 neckline resistance.
Trending Stories
Furthermore, the prices have nearly reached the peak of the triangle indicating the breakout opportunity is near. Therefore, considering the higher possibility, a daily candle closing about the $0.000185 resistance will signal the release of trapped bullish momentum.
Also Read: Explained: What is Physical NFT? and How to Sell Physical Items as NFT
This breakout will offer buyers a suitable footing for a strong recovery rally. Thus, in favorable bullish conditions, the post-breakout rally may surge the LUNC Crypto price 36% high to hit the $0.00025 mark.
On the contrary note, a breakdown below the support trendline will undermine the Bullish thesis.
Technical Indicators
Relative strength index: the daily RSI slope continues to waver above the midline, indicating the market sentiment remains bullish.
advertisement
Bollinger Band: the upward direction of the Bollinger Bands indicator reflects a sustained recovery in LUNC price.
LUNC Crypto Price Intraday Levels
- Spot rate: $0.000175
- Trend: Bullish
- Volatility: High
- Resistance level- $0.000185 and $0.0002
- Support level- $0.00015 and $0.000125
Share this article on:
The presented content may include the personal opinion of the author and is subject to market condition. Do your market research before investing in cryptocurrencies. The author or the publication does not hold any responsibility for your personal financial loss.
- SEO Powered Content & PR Distribution. Get Amplified Today.
- Platoblockchain. Web3 Metaverse Intelligence. Knowledge Amplified. Access Here.
- Source: https://coingape.com/markets/heres-why-lunc-crypto-price-could-skyrocket-in-february-2023/

