- Today’s early Asian session’s swift rally to a fresh all-time high is likely to be driven by a thin liquidity trading environment rather than the Israel-Hamas geopolitical war risk premium.
- Spot Gold’s portfolio hedging role may gain traction as global recession risk resurfaces.
- Medium-term uptrend phase remains intact but may shape a minor pull-back below US$2,152 key short-term pivotal resistance with immediate supports at US$2,032/2,018.
This is a follow-up analysis of our prior report, “Gold Technical: Potential multi-week bullish movement kickstarts” published on 21 November 2023. Click here for a recap.”
The price actions of Spot Gold (XAU/USD) have continued to push higher since our last analysis where it clear above the short-term resistance zone of US$2,028/2,037and rallied to retest its current all-time high level of US$2,075 (printed in August 2020) on last Friday, 1 December 2023.
In today’s (4 December) early Asian session before the opening of Tokyo trading hours, Spot Gold spurted upwards to hit a fresh intraday all-high of around US$2,148 before it almost gave up all its gains to trade at US$2,083 at this time of the writing.
Despite an uplift in geopolitical tensions in the Middle Eastern region after Israel resumed its offensive operations against Hamas in Gaza over the weekend, the geopolitical war risk premium is not being priced in the current price actions of oil where WTI crude remained soft ex-post OPEC+ meeting and it traded lower in today’s Asian session with an intraday loss of -1.10%.
Hence today’s intraday swift rally that lasted for around thirty minutes towards a fresh all-time high is likely to be driven by a thin liquidity environment at the start of the week rather than fundamental catalysts.
Potential global recession scenario is supporting a medium-term uptrend
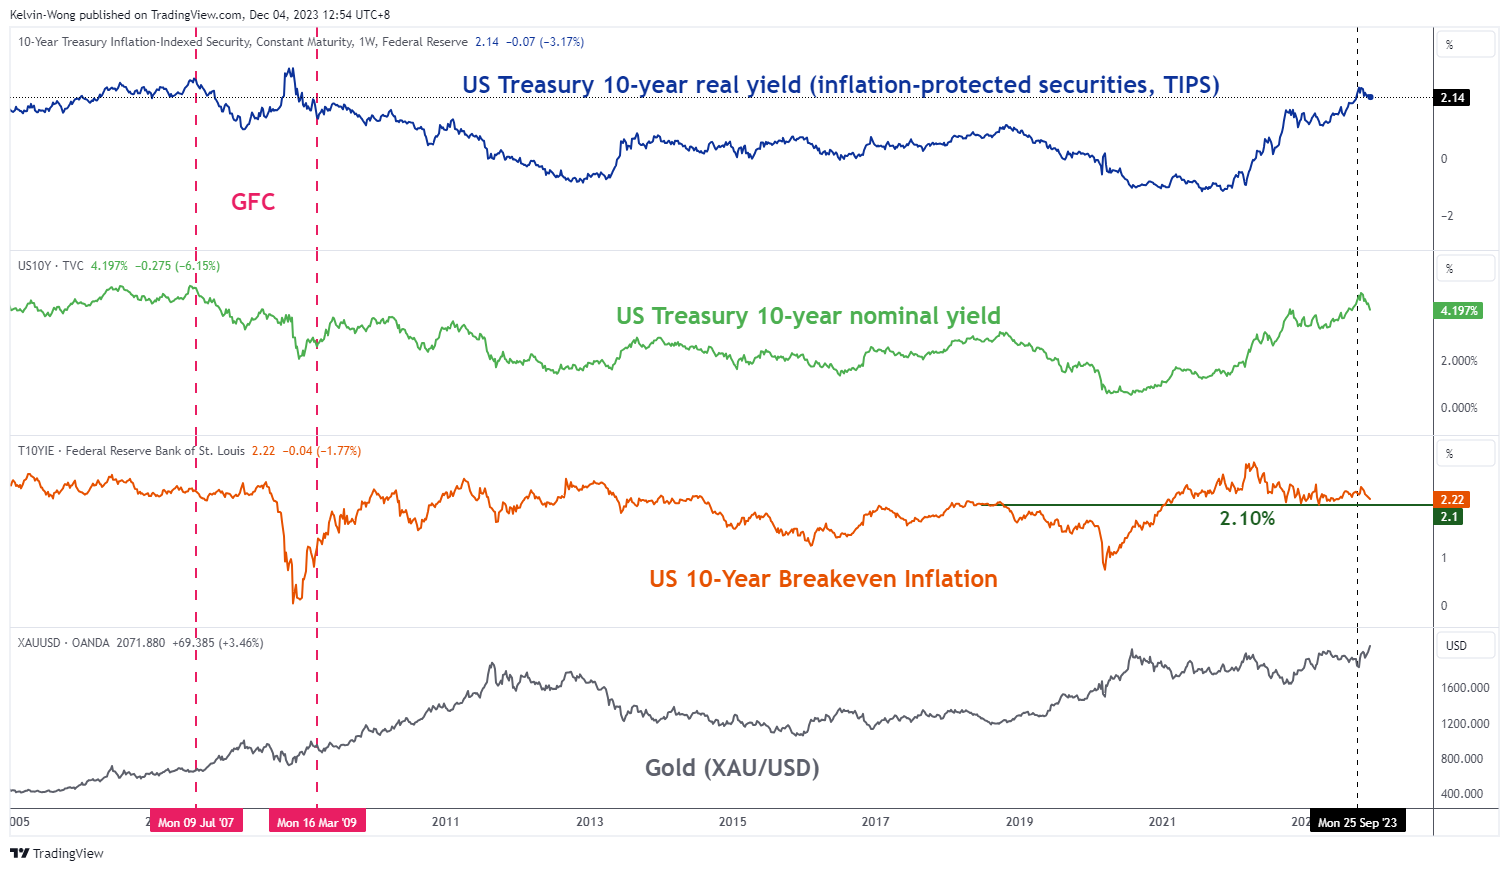
Fig 1: US 10-year Treasury real yield medium-term trend with breakeven inflation as of 4 Dec 2023 (Source: TradingView, click to enlarge chart)
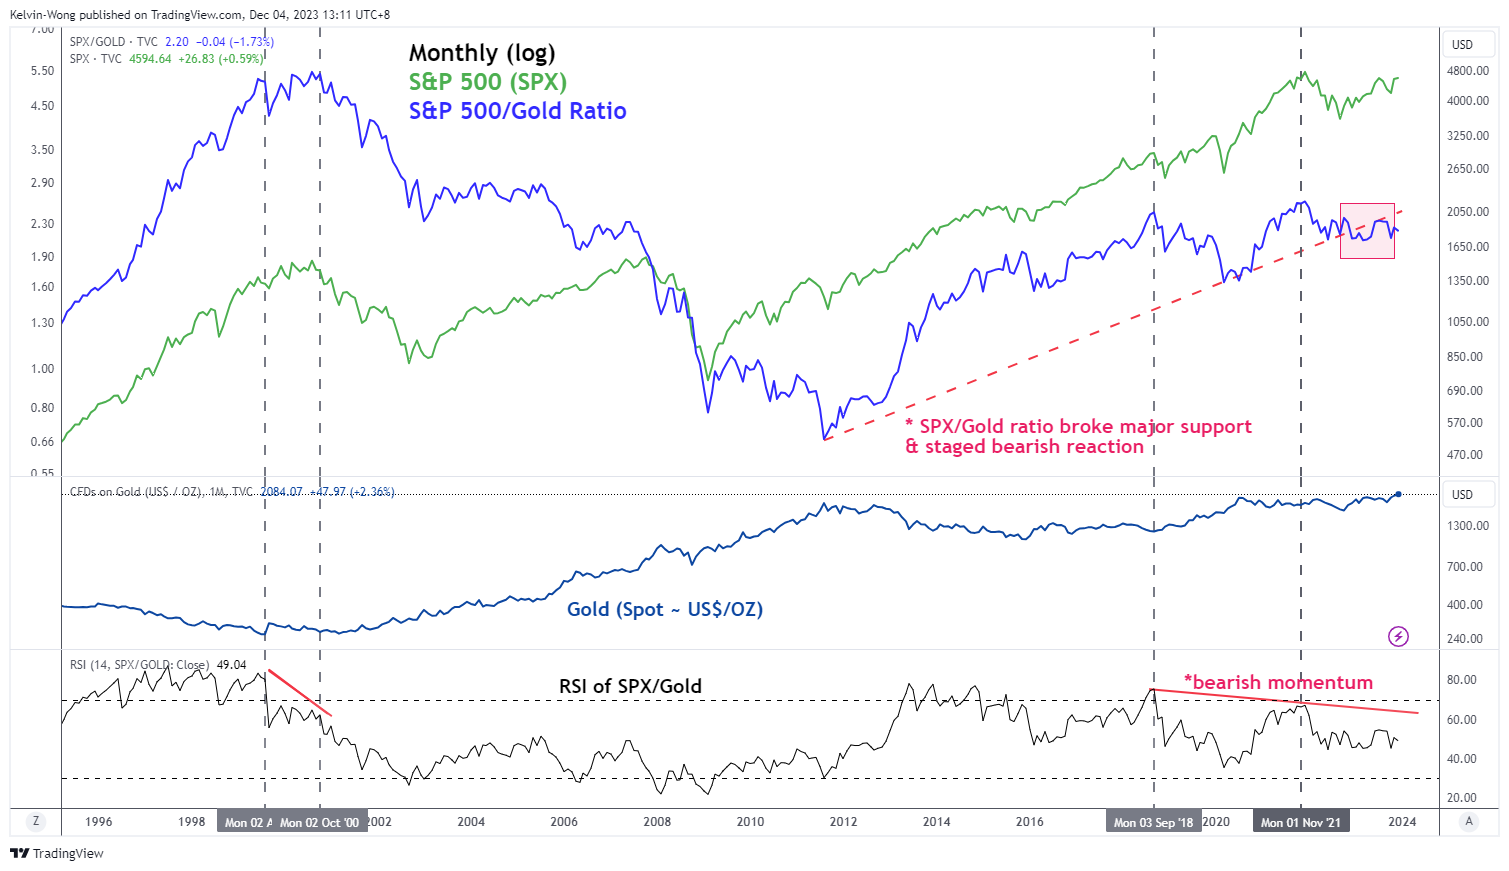
Fig 2: S&P 500 – Spot Gold ratio as of 4 Dec 2023 (Source: TradingView, click to enlarge chart)
The next golden question will be is the current medium-term uptrend for Spot Gold sustainable after a rally of +18% from its 6 October 2023 low, and a third major retest on the US$2,075 high printed on 7 August 2020?
Using an intermarket analysis approach (see Fig 1 & 2), the medium-term uptrend phase low of 6 October 2023 seen in Spot Gold has coincided closely with the recent softness of the US 10-year Treasury real yield as it has declined by 47 basis points from 2.47% printed on 6 October 2023.
Also, the US 10-year breakeven rate (market-based implied US inflation rate 10 years from today) is looking vulnerable for a bearish breakdown below 2.10% suggesting that the US 10-year Treasury real yield still has room for further potential downside that in turn lowers the opportunity costs of holding gold.
Secondly, the long-term monthly ratio chart of the US S&P 500 against Spot Gold has continued to exhibit potential S&P 500 underperformance against Spot Gold as it has remained below a former major ascending support from August 2011 low with bearish momentum reading seen in the monthly RSI indicator of the S&P 500 – Spot Gold ratio; a sign of a potential imminent US recession.
Therefore, these two intermarket analyses suggest an increasing risk of a global recession which in turn may allow the current medium-term uptrend phase of Spot Gold to remain intact via its portfolio hedging role.
Overextended short-term rally in Spot Gold
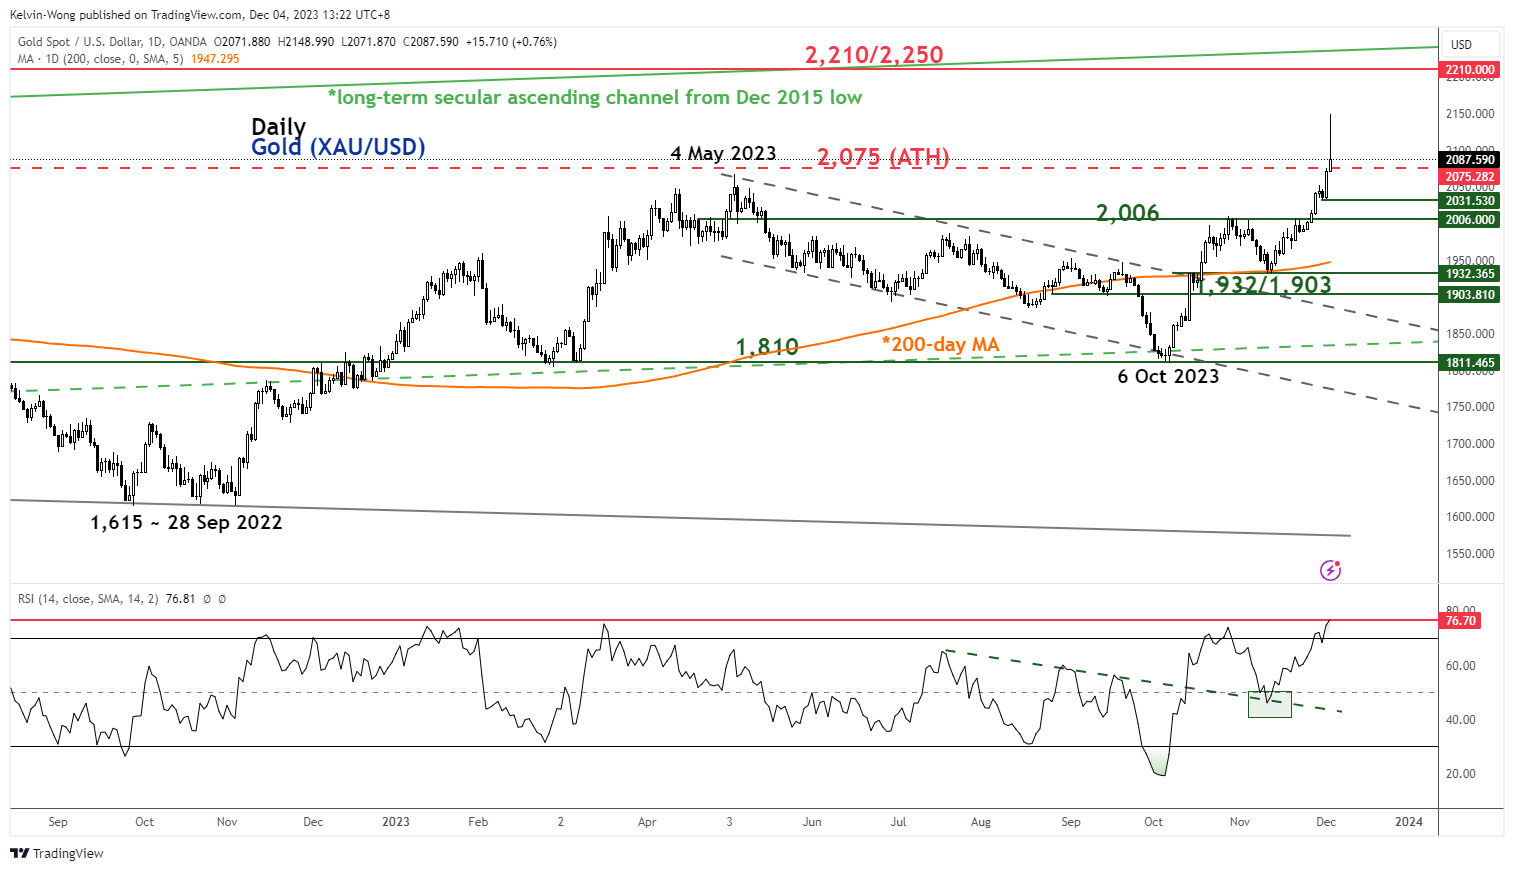
Fig 3: Spot Gold (XAU/USD) medium-term trend as of 4 Dec 2023 (Source: TradingView, click to enlarge chart)
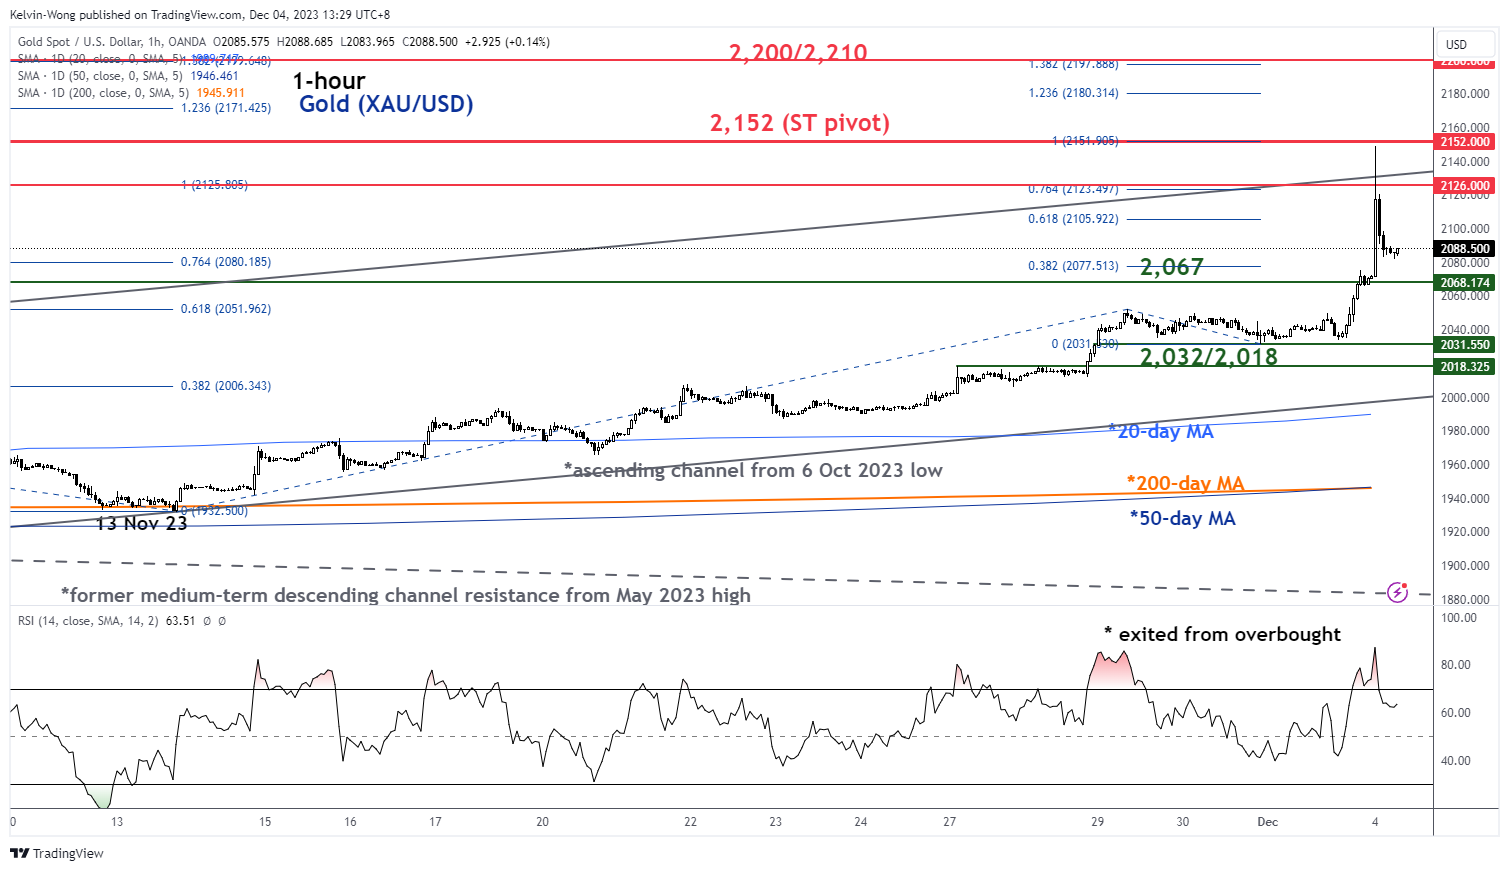
Fig 4: Spot Gold (XAU/USD) minor short-term trend as of 4 Dec 2023 (Source: TradingView, click to enlarge chart)
In the lens of technical analysis, price actions of highly liquid traded instruments and assets do not move in vertical up or down movements but rather oscillate within their trends as market participants react to the ebbs and flows of new catalysts.
Today’s swift rally has led Spot Gold (XAU/USD) to hit an extremely overbought level where the current daily RSI momentum is at 76.70, its highest level so far since the current medium-term uptrend started on 6 October 2023 low.
On the hourly short-term chart, the price actions of XAU/USD have reacted off the upper boundary of the ascending channel from the 6 October 2023 low now acting as a near-term resistance of US$2,126.
In addition, the hourly RSI momentum indicator has just exited from its overbought region which increases the risk of a minor-pull back scenario within an ongoing medium-term uptrend phase.
Watch the US$2,152 key short-term pivotal resistance on XAU/USD and a break below US2,067 near-term support (former swing high areas of 4 May 2023/28 March 2023) exposes the next immediate support zone of US$2,032/2,018.
On the other hand, a clearance above US$2,152 sees a major resistance zone coming in at US$2,200/2,210.
Content is for general information purposes only. It is not investment advice or a solution to buy or sell securities. Opinions are the authors; not necessarily that of OANDA Business Information & Services, Inc. or any of its affiliates, subsidiaries, officers or directors. If you would like to reproduce or redistribute any of the content found on MarketPulse, an award winning forex, commodities and global indices analysis and news site service produced by OANDA Business Information & Services, Inc., please access the RSS feed or contact us at [email protected]. Visit https://www.marketpulse.com/ to find out more about the beat of the global markets. © 2023 OANDA Business Information & Services Inc.
Latest posts by Kelvin Wong (see all)
- SEO Powered Content & PR Distribution. Get Amplified Today.
- PlatoData.Network Vertical Generative Ai. Empower Yourself. Access Here.
- PlatoAiStream. Web3 Intelligence. Knowledge Amplified. Access Here.
- PlatoESG. Carbon, CleanTech, Energy, Environment, Solar, Waste Management. Access Here.
- PlatoHealth. Biotech and Clinical Trials Intelligence. Access Here.
- Source: https://www.marketpulse.com/commodities/gold-technical-medium-term-uptrend-remains-intact-but-risk-of-minor-pull-back/kwong

