Amazon Kendra is a highly accurate and intelligent search service that enables users to search unstructured and structured data using natural language processing (NLP) and advanced search algorithms. With Amazon Kendra, you can find relevant answers to your questions quickly, without sifting through documents. However, just enabling end-users to get the answers to their queries is not enough in today’s world. We need to constantly understand the end-user’s search behavior, such as what are the top queries for the month, have any new query that queries appeared recently, what percentage of queries received instant answer, and more.
Although the Amazon Kendra console comes equipped with an analytics dashboard, many of our customers prefer to build a custom dashboard. This allows you to create unique views and filters, and grants management teams access to a streamlined, one-click dashboard without needing to log in to the AWS Management Console and search for the appropriate dashboard. In addition, you can enhance your dashboard’s functionality by adding preprocessing logic, such as grouping similar top queries. For example, you may want to group similar queries such as “What is Amazon Kendra” and “What is the purpose of Amazon Kendra” together so that you can effectively analyze the metrics and gain a deeper understanding of the data. Such grouping of similar queries can be done using the concept of semantic similarity.
This post discusses an end-to-end solution to implement this use case, which includes using AWS Lambda to extract the summarized metrics from Amazon Kendra, calculating the semantic similarity score using a Hugging Face model hosted on an Amazon SageMaker Serverless Inference endpoint to group similar queries, and creating an Amazon QuickSight dashboard to display the user insights effectively.
Solution overview
The following diagram illustrates our solution architecture.

The high-level workflow is as follows:
- An Amazon EventBridge scheduler triggers Lambda functions once a month to extract last month’s search metrics from Amazon Kendra.
- The Lambda functions upload the search metrics to an Amazon Simple Storage Service (Amazon S3) bucket.
- The Lambda functions group similar queries in the uploaded file based on the semantic similarity score by Hugging Face model hosted on a SageMaker inference endpoint.
- An AWS Glue crawler creates or updates the AWS Glue Data Catalog from the uploaded file in the S3 bucket for an Amazon Athena table.
- QuickSight uses the Athena table dataset to create analyses and dashboards.
For this solution, we deploy the infrastructure resources to create the QuickSight analysis and dashboard using an AWS CloudFormation template.
Prerequisites
Complete the following prerequisite steps:
- If you’re a first-time user of QuickSight in your AWS account, sign up for QuickSight.
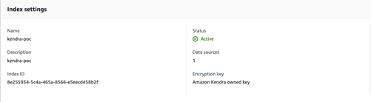
- Get the Amazon Kendra index ID that you want visualize your search metrics from Amazon Kendra. You will have to use the search engine for a while (for example, a few weeks) to be able to extract a sufficient amount of data to use to extract some insights.
- Clone the GitHub repo to create the container image:
- Create an Amazon Elastic Container Registry (Amazon ECR) repository in us-east-1 and push the container image created by the downloaded Dockerfile. For instructions, refer to Creating a private repository.
- Run the following commands in the directory of your local environment to create and push the container image to the ECR repository you created:
Deploy the CloudFormation template
Complete the following steps to deploy the CloudFormation template:
- Download the CloudFormation template kendrablog-sam-template.yml.
- On the AWS CloudFormation console, create a new stack.
Use the us-east-1 Region for this deployment.
- Upload the template directly or through your preferred S3 bucket.

- For KendraIndex, enter the Amazon Kendra index ID from the prerequisites.
- For LambdaECRRepository, enter the ECR repository from the prerequisites.
- For QSIdentityRegion, enter the identity Region of QuickSight. The identity Region aligns with your Region selection when you signed up your QuickSight subscription.
- For QSUserDefaultPassward, enter the default password to use for your QuickSight user.
You’ll be prompted to change this password when you first sign in to the QuickSight console.
- For QSUserEmail, enter the email address to use for the QuickSight user.
- Choose Next.

- Leave other settings as default and choose Next.

- Select the acknowledgement check boxes and choose Create stack.

When the deployment is complete, you can confirm all the generated resources on the stack’s Resources tab on the AWS CloudFormation console.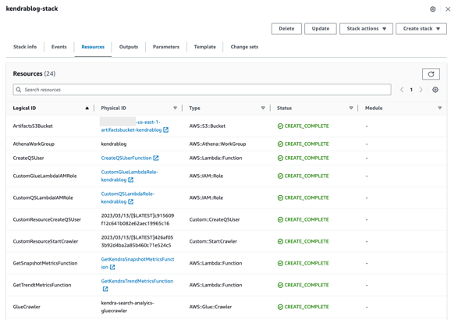
We walk through some of the key components of this solution in the following sections.
Get insights from Amazon Kendra search metrics
We can get the metrics data from Amazon Kendra using the GetSnapshots API. There are 10 metrics for analyzing what information the users are searching for: 5 metrics include trends data for us to look for patterns over time, and 5 metrics use just a snapshot or aggregated data. The metrics with the daily trend data are clickthrough rate, zero click rate, zero search results rate, instant answer rate, and total queries. The metrics with aggregated data are top queries, top queries with zero clicks, top queries with zero search results, top clicked on documents, and total documents.
We use Lambda functions to get the search metrics data from Amazon Kendra. The functions extract the metrics from Amazon Kendra and store them in Amazon S3. You can find the functions in the GitHub repo.
Create a SageMaker serverless endpoint and host a Hugging Face model to calculate semantic similarity
After the metrics are extracted, the next step is to complete the preprocessing for the aggregated metrics. The preprocessing step checks the semantic similarity between the query texts and groups them together to show the total counts for the similar queries. For example, if there are three queries of “What is S3” and two queries of “What is the purpose of S3,” it will group them together and show that there are five queries of “What is S3” or “What is the purpose of S3.”
To calculate semantic similarity, we use a model from the Hugging Face model library. Hugging Face is a popular open-source platform that provides a wide range of NLP models, including transformers, which have been trained on a variety of NLP tasks. These models can be easily integrated with SageMaker and take advantage of its rich training and deployment options. The Hugging Face Deep Learning Containers (DLCs), which comes pre-packaged with the necessary libraries, make it easy to deploy the model in SageMaker with just few lines of code. In our use case, we first get the vector embedding using the Hugging Face pre-trained model flax-sentence-embeddings/all_datasets_v4_MiniLM-L6, and then use cosine similarity to calculate the similarity score between the vector embeddings.
To get the vector embedding from the Hugging Face model, we create a serverless endpoint in SageMaker. Serverless endpoints help save cost because you only pay for the amount of time the inference runs. To create a serverless endpoint, you first define the max concurrent invocations for a single endpoint, known as MaxConcurrency, and the memory size. The memory sizes you can choose are 1024 MB, 2048 MB, 3072 MB, 4096 MB, 5120 MB, or 6144 MB. SageMaker Serverless Inference auto-assigns compute resources proportional to the memory you select.
We also need to pad one of the vectors with zeros so that the size of the two vectors matches with each other and we can calculate the cosine similarity as a dot product of the two vectors. We can set a threshold for cosine similarity (for example, 0.6) and if the similarity score is more than the threshold, we can group the queries together. After the queries are grouped, we can understand the top queries better. We put all this logic in a Lambda function and deploy the function using a container image. The container image contains codes to invoke the SageMaker Serverless Inference endpoints, and necessary Python libraries to run the Lambda function such as NumPy, pandas, and scikit-learn. The following file is an example of the output from the Lambda function: HF_QUERIES_BY_COUNT.csv.
Create a dashboard using QuickSight
After you have collected the metrics and preprocessed the aggregated metrics, you can visualize the data to get the business insights. For this solution, we use QuickSight for the business intelligence (BI) dashboard and Athena as the data source for QuickSight.
QuickSight is a fully managed enterprise-grade BI service that you can use to create analyses and dashboards to deliver easy-to-understand insights. You can choose various types of charts and graphs to deliver the business insights effectively through a QuickSight dashboard. QuickSight connects to your data and combines data from many different sources, such as Amazon S3 and Athena. For our solution, we use Athena as the data source.
Athena is an interactive query service that makes it easy to analyze data directly in Amazon S3 using standard SQL. You can use Athena queries to create your custom views from data stored in an S3 bucket before visualizing it with QuickSight. This solution uses an AWS Glue crawler to create the AWS Glue Data Catalog for the Athena table from the files in the S3 bucket.
The CloudFormation template runs the first crawler during resource creation. The following screenshot shows the Data Catalog schema.

The following screenshot shows the Athena table sample you will see after the deployment.

Access permission to the AWS Glue databases and tables are managed by AWS Lake Formation. The CloudFormation template already attached the necessary Lake Formation permissions to the generated AWS Identity and Access Management (IAM) user for QuickSight. If you see permission issues with your IAM principal, grant at least the SELECT permission to the AWS Glue tables to your IAM principal in Lake Formation. You can find the AWS Glue database name on the Outputs tab of the CloudFormation stack. For more information, refer to Granting Data Catalog permissions using the named resource method.
We have completed the data preparation step. The last step is to create an analysis and dashboard using QuickSight.
- Sign in to the QuickSight console with the QuickSight user that the CloudFormation template generated.
- In the navigation pane, choose Datasets.
- Choose Dataset.
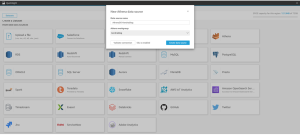
- Choose Athena as the data source.
- Enter a name for Data Source name and choose
kendrablogfor Athena workgroup. - Choose Create data source.
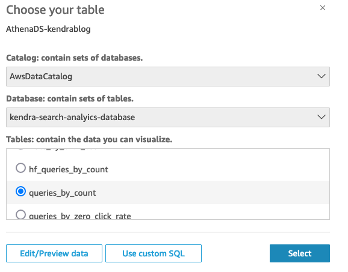
- Choose
AWSDataCatalogfor Catalog andkendra-search-analytics-databasefor Database, and select one of the tables you want to use for analysis. - Choose Select.
- Select Import to SPICE for quicker analytics and choose Edit/Preview data.
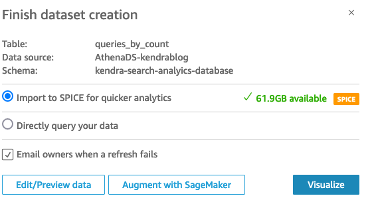
- Optionally, choose Add data to join additional data.
- You can also modify the data schema, such as column name or data type, and join multiple datasets, if needed.
- Choose Publish & Visualize to move on to creating visuals.

- Choose your visual type and set dimensions to create your visual.
- You can optionally configure additional features for the chart using the navigation pane, such as filters, actions, and themes.

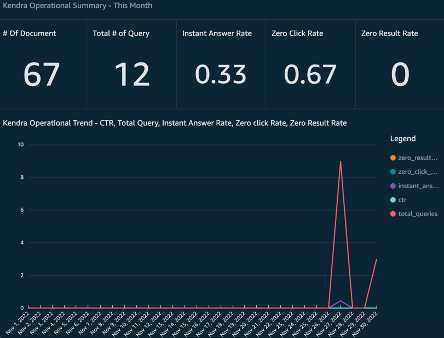
The following screenshots show a sample QuickSight dashboard for your reference. “Search Queries group by similar queries” in the screenshot shows how the search queries been consolidated using semantic similarity.


Clean up
Delete the QuickSight resources (dashboard, analysis, and dataset) that you created and infrastructure resources that AWS CloudFormation generated to avoid unwanted charges. You can delete the infrastructure resource and QuickSight user that was created by the stack via the AWS CloudFormation console.
Conclusion
This post showed an end-to-end solution to get business insights from Amazon Kendra. The solution provided the serverless stack to deploy a custom dashboard for Amazon Kendra search analytics metrics using Lambda and QuickSight. We also solved common challenges relating to analyzing similar queries using a SageMaker Hugging Face model. You could further enhance the dashboard by adding more insights such as the key phrases or the named entities in the queries using Amazon Comprehend and displaying those in the dashboard. Please try out the solution and let us know your feedback.
About the Authors
 Genta Watanabe is a Senior Technical Account Manager at Amazon Web Services. He spends his time working with strategic automotive customers to help them achieve operational excellence. His areas of interest are machine learning and artificial intelligence. In his spare time, Genta enjoys spending time with his family and traveling.
 Abhijit Kalita is a Senior AI/ML Evangelist at Amazon Web Services. He spends his time working with public sector partners in Asia Pacific, enabling them on their AI/ML workloads. He has many years of experience in data analytics, AI, and machine learning across different verticals such as automotive, semiconductor manufacturing, and financial services. His areas of interest are machine learning and artificial intelligence, especially NLP and computer vision. In his spare time, Abhijit enjoys spending time with his family, biking, and playing with his little hamster.
- SEO Powered Content & PR Distribution. Get Amplified Today.
- PlatoAiStream. Web3 Data Intelligence. Knowledge Amplified. Access Here.
- Minting the Future w Adryenn Ashley. Access Here.
- Buy and Sell Shares in PRE-IPO Companies with PREIPO®. Access Here.
- Source: https://aws.amazon.com/blogs/machine-learning/get-insights-on-your-users-search-behavior-from-amazon-kendra-using-an-ml-powered-serverless-stack/

