- In the recent past three months, the 40% rally seen in the WTI crude oil has a significant direct correlation with the US 10-year US Treasury yield.
- A higher US 10-year US Treasury yield has trigged a short-term downtrend in global equities since late July 2023.
- WTI crude oil futures gapped up by +5% in today’s Asia opening session due to the ongoing hostilities between Israel and Hamas, the Palestinian militant group.
- A further up move above a key short-term resistance of US$89.70/barrel on WTI crude oil futures may trigger another potential round of “pain trade” for global equities.
The unfortunate turn of events that took place in Israel over the weekend triggered an official declaration of war on Hamas, the Palestinian militant group by the Israeli government. The scale of the surprise attack by Hamas on Israeli soil is the most drastic since the Yom Kippur War in 1973.
Given that Israel is a strategic stakeholder in international relations within the Middle East region, a further escalation of the current armed conflict may see a rise in oil price supply disruptions which tends to be used as a “choice strategic weapon” for potential bargaining chips among the stakeholders that are involved in the conflict.
Inflationary expectations have moved in tandem with WTI crude oil
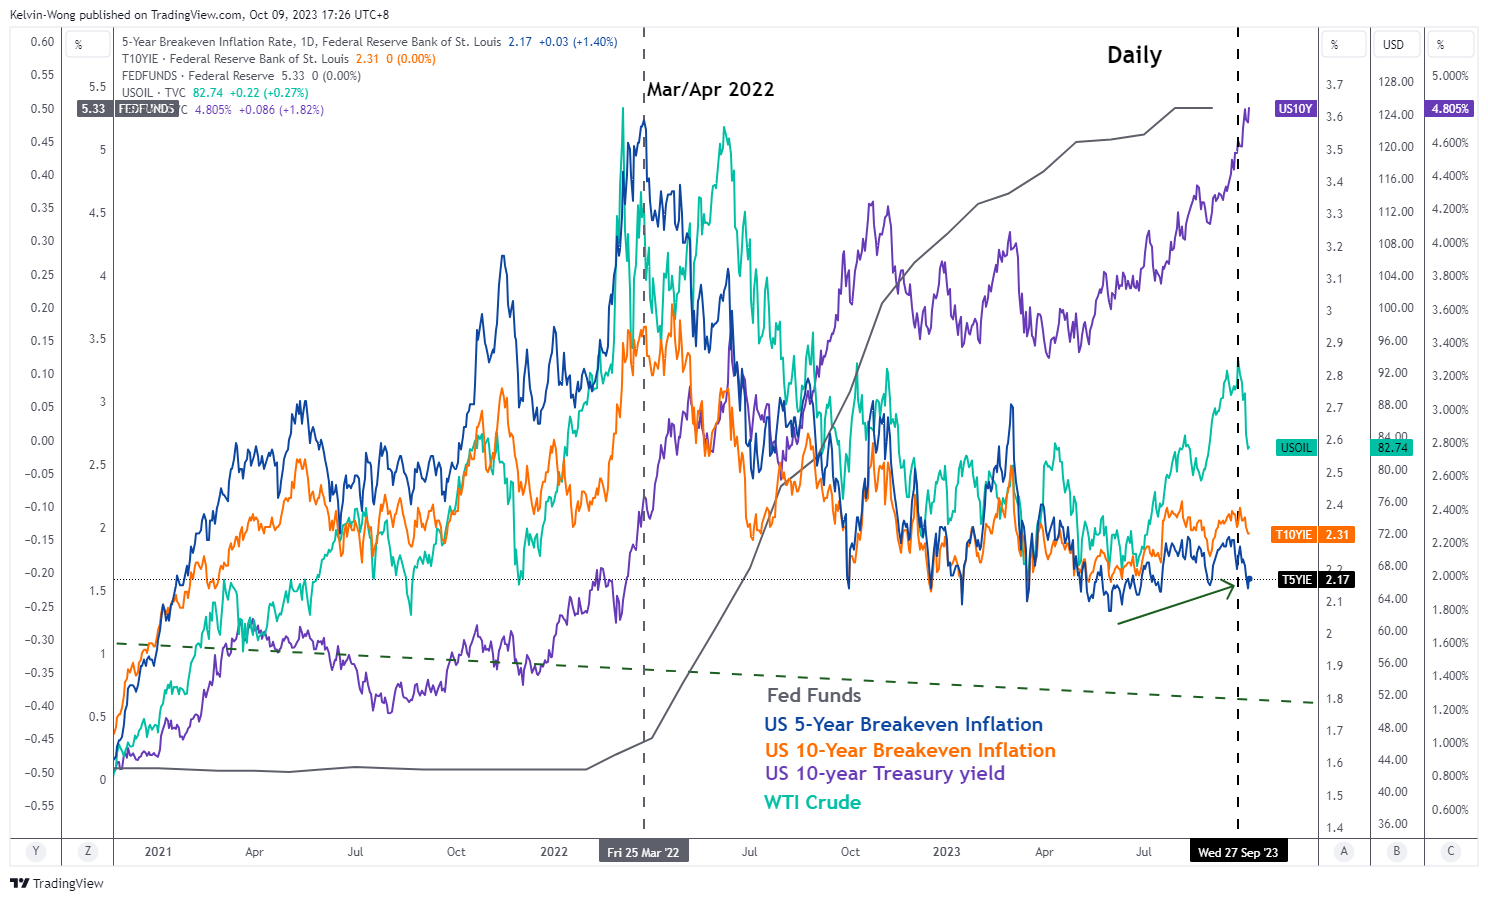
Fig 1: Correlation between WTI crude oil, US breakeven inflation rates & US 10-year Treasury yield as of 9 Oct 2023 (Source: TradingView, click to enlarge chart)
Based on intermarket analysis, the recent three-month rally of 40% seen in the WTI crude oil from mid-June to the end of September has a significant direct correlation with inflationary expectations inferred by market transacted US 10 and 5-year breakeven inflation rates. The tandem rise seen in the price movements of WTI crude oil with these breakeven inflation rates in the past three months has in turn driven up longer-term US Treasury yields such as the 10-year that jumped by 100 basis points over the same period and even continued to extend its ascend in the first week of October to print an intraday high of 4.88% on last Wednesday, 4 October, a high last seen in July 2007.
Higher longer-term US Treasury yields triggered a short-term downtrend in the S&P 500
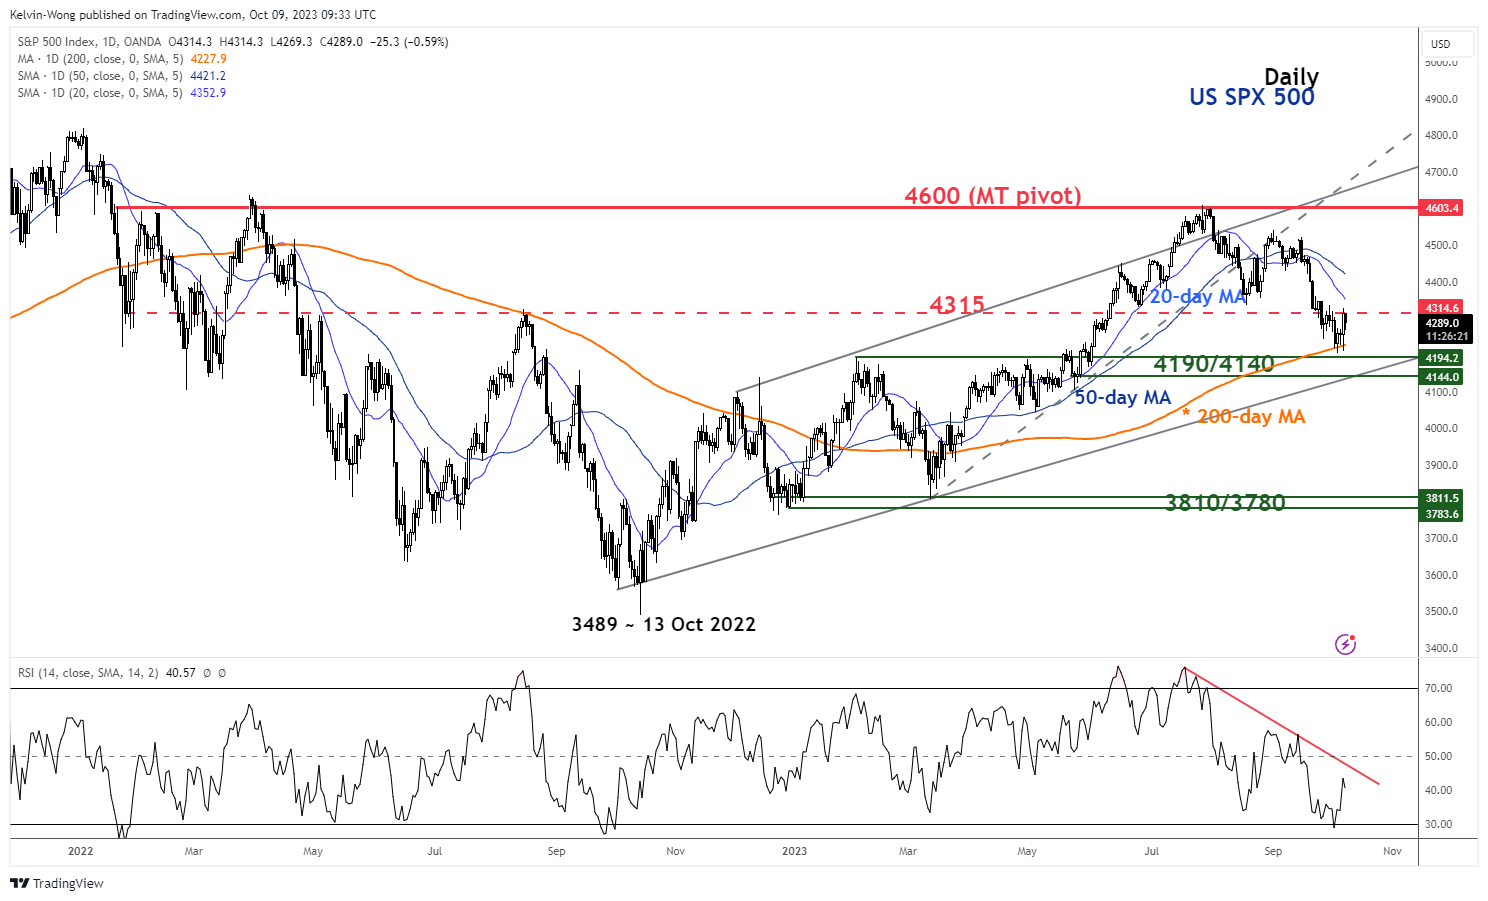
Fig 2: US S&P 500 medium-term trend as of 9 Oct 2023 (Source: TradingView, click to enlarge chart)
The push-up seen in the US 10-year Treasury yield is also one of the primary factors that led to the current short-term downtrend seen in global equities in the last two months; using the US benchmark stock index, S&P 500 as a leading global gauge that broke below its 20 and 50-day moving averages with a loss of around -8% from is 27 July 2023 high to its recent 4 October 2023 low.
The US 10-year Treasury yield is a global benchmark long-term “risk-free” interest rate and a further push up in the 10-year yield towards a key major resistance of 5.20% may trigger a “pain environment” for long-duration risk assets such as equities due to a higher cost funding that is likely to be detrimental to earnings growth which in turn increases the opportunity costs of holding equities over fixed income via the equity risk premium factor.
Hence, as highlighted earlier, the 10-year US Treasury yield has been indirectly influenced by higher WTI crude oil prices triggered by the behavioural conduit from higher inflationary expectations that are likely to maintain the US central bank, the Fed’s current stance of maintaining a higher level of interest rates for a longer period.
Therefore, it is paramount to decipher the current sentiment of the WTI crude from the lens of technical analysis and the key level that may kickstart another potential impulsive move sequence within its medium-term uptrend in place since June 2023.
WTI crude oil gapped up above its 50-day moving average
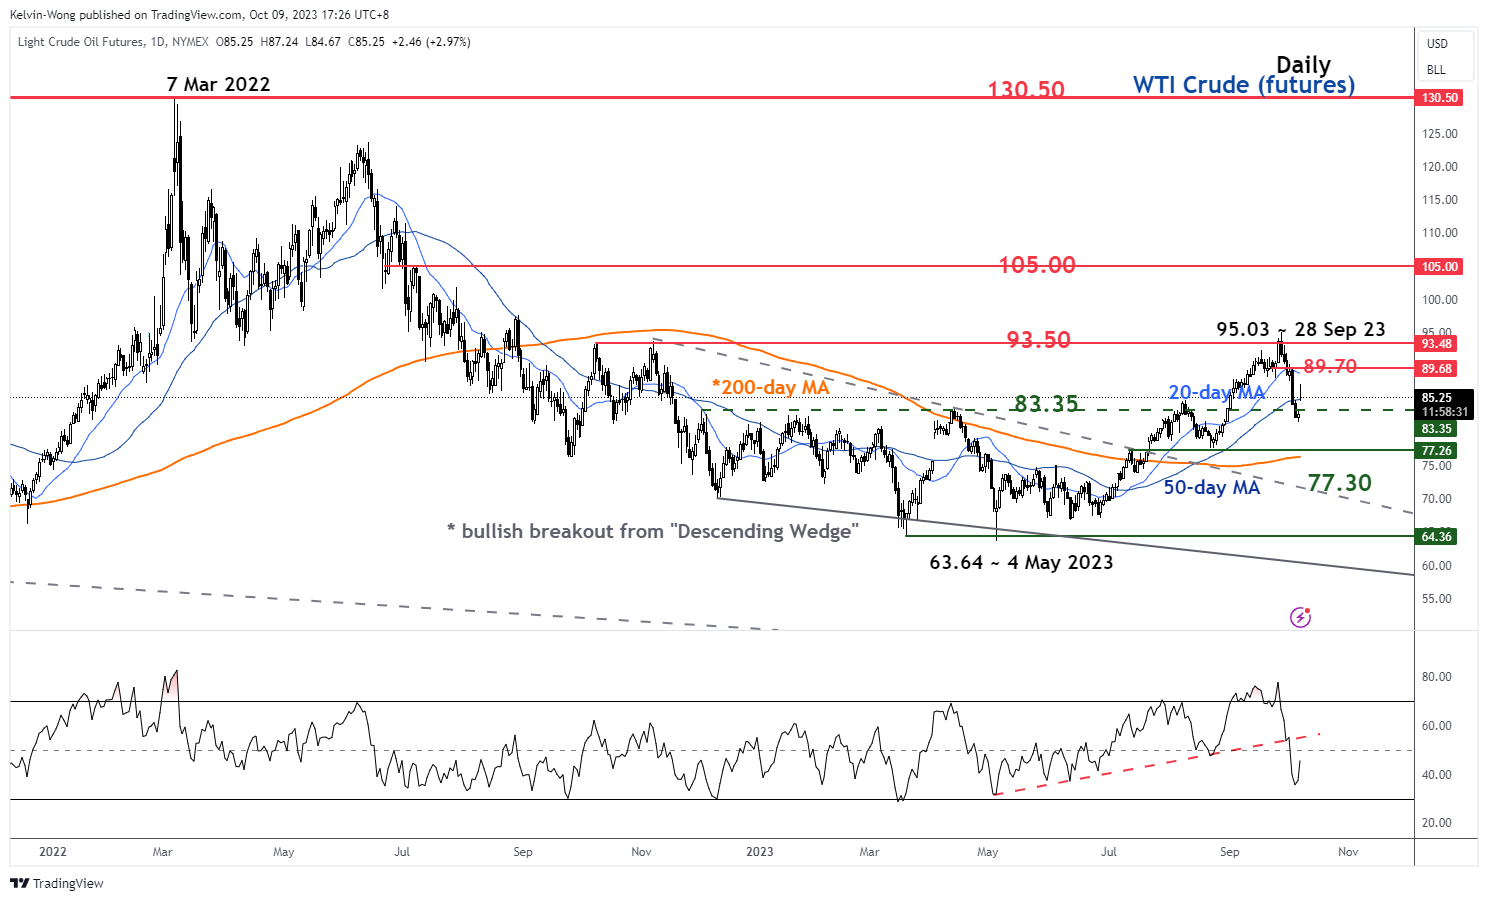
Fig 3: WTI crude oil futures medium-term trend as of 9 Oct 2023 (Source: TradingView, click to enlarge chart)
Using the daily chart of the WTI crude oil futures, the recent -12.50% decline from its 28 September 2023 high of US$95.03/barrel to 6 October 2023 low of US$81.50/barrel is likely to be a short-term downtrend movement to retrace the prior medium-term uptrend phase from 4 May 2023 low as price actions have broken and closed below the 20 and 50-day moving averages prior to the weekend’s hostilities in Israel.
In today’s Asia opening session, the WTI crude oil futures have staged a gapped up above the 50-day moving average and rallied by +5.4% to print a current intraday high of US$87.24/barrel before it trimmed some of its intraday gains to +3% and it is still trading above its “gapped up support” at US$83.35/barrel at this time of the writing.
If price actions of the WTI crude oil futures have managed to push higher and cleared above the key short-term resistance of US$89.70/barrel with a daily close above it, the odds will be skewed towards the potential start of another impulsive up movement sequence within its medium-term uptrend phase that may see a test on the US$105.00 major resistance.
Hence, how the price actions movement of WTI crude oil unfolds in the next few days and weeks is likely to have a spill-over intermarket reactionary effect on the US 10-year US Treasury yield and a further potential pain trade in risk assets such as equities may be still lingering around the corner as the implied geopolitical risk premium is likely to increase if WTI crude oil futures can stage a bullish breakout scenario above US$89.70/barrel.
Content is for general information purposes only. It is not investment advice or a solution to buy or sell securities. Opinions are the authors; not necessarily that of OANDA Business Information & Services, Inc. or any of its affiliates, subsidiaries, officers or directors. If you would like to reproduce or redistribute any of the content found on MarketPulse, an award winning forex, commodities and global indices analysis and news site service produced by OANDA Business Information & Services, Inc., please access the RSS feed or contact us at [email protected]. Visit https://www.marketpulse.com/ to find out more about the beat of the global markets. © 2023 OANDA Business Information & Services Inc.
Latest posts by Kelvin Wong (see all)
- SEO Powered Content & PR Distribution. Get Amplified Today.
- PlatoData.Network Vertical Generative Ai. Empower Yourself. Access Here.
- PlatoAiStream. Web3 Intelligence. Knowledge Amplified. Access Here.
- PlatoESG. Carbon, CleanTech, Energy, Environment, Solar, Waste Management. Access Here.
- PlatoHealth. Biotech and Clinical Trials Intelligence. Access Here.
- Source: https://www.marketpulse.com/commodities/geopolitical-risk-premium-on-the-rise-may-trigger-another-round-of-risk-off-movement-in-equities/kwong

