Your gateway to successful crypto investing guided by data and research
Key Takeaways
- Market Momentum: Despite evident signs of panic selling and increased offloading by short-term holders, Bitcoin’s price held its range and managed to stage a rebound. Against a backdrop of broader financial sector instability, Bitcoin’s price stands out for its resilience, with metrics like the Realized Market Cap hinting at a possible surge in interest from new market participants.
- Risk Vectors: The cryptocurrency market is currently navigating three primary risk vectors: macroeconomic challenges highlighted by global bond market turmoil and shrinking M2 money supply, Bitcoin’s liquidity concerns leading to potential price volatility, and the unique positioning in the Bitcoin options market where dealers are predominantly short on BTC gamma. This combination of factors creates a landscape of potential amplified price movements, both upwards and downwards,
- On-Chain Basics: The MVRV Ratio, a comparison of a cryptocurrency’s current price to its last traded average price, offers traders insights into unrealized profits within the supply, helping identify market extremes, trends, and potential early warning signs. With applications in risk management, strategic trading, and portfolio diversification, it’s a vital tool for institutional entities in the digital asset space.
A Month in Review: September
Last month, Bitcoin recorded a 4% growth, defying a 6-year streak of negative returns in September and setting the stage up for a potential continuation of the positive trend in October. However, notable challenges – both crypto-specific and macroeconomic – may make it harder for Bitcoin to match its historical seasonal trend of a strong and positive start to Q4.
More specifically, these challenges include the continuation of the trend of contracting liquidity, with both on-chain and off-chain volumes touching multi-year lows. This decline in liquidity was mirrored by a sentiment of market indifference, characterized by a tight trading range and suppressed volatility.
One of the most important reasons for the low trading volume is the relatively low number of active market participants. The current market is dominated by long-term holders whose share in the total supply of Bitcoin reached in September an all-time high of 76%.

This is also reflected in the Realized Cap HODL (RHODL) waves metric which represents the balance of wealth distribution between seasoned holders and new investors in the Bitcoin market. This metric reveals that old coins remained largely stationary in September, suggesting not just a lack of spending momentum but also a relatively weak influx of new demand. Such a pattern, where predominantly the HODLers remain active, is typical of the bear market hangover phase and indicates a market that is currently stagnant.

While low liquidity can lead to outsized moves in either direction, Bitcoin’s market volatility was also in a downtrend throughout September. Additionally, looking at the options market, we can see that market participants aren’t pricing in significant price fluctuations in the near future. Levels of implied volatility were considerably below historical averages, nearing all-time lows.

However, historically periods of low volatility have often been precursors to more volatile phases, especially when the market isn’t pricing in potential volatility shifts (as we saw in the middle of August). Interestingly, as we explain in the Risk Vectors section, the current setup in the options market can actually exacerbate any price action in the Bitcoin market – whether to the upside or to the downside.
Furthermore, on-chain data highlighted that a super-majority of Short-Term Holders (STH) found themselves in a negative position. This high percentage of underwater STHs can be interpreted as a sign of potential seller exhaustion.

Such a scenario could have implications for future market dynamics, as exhausted sellers might lead to reduced selling pressure, potentially setting the stage for a market rebound or, at least, a solid consolidation at current price levels. We explore other on-chain metrics that support this thesis in greater detail in Market Momentum.
In the previous edition of Finance Bridge, we noted that the market was giving the appearance of being top-heavy. We had broken below the short-term holder cost basis, meaning that the average short-term holder had to contend with unrealized losses. This trend continued to the point where the price was sitting at the edge of a cluster of supply dominated by short-term holders.

Such a market structure, where a supermajority of short-term holders are falling deeper and deeper into loss, could potentially result in a capitulation from this group and take the price of Bitcoin below the technical support levels.
At first glance, it may seem that the market reacted differently. The price held at the $26K level and recovered to retest the underside of the short-term holder cost basis, which has since failed to hold. Notably, this level aligns with both the 200-day and 200-week moving averages, providing a confluence of both technical and on-chain indicators. While encountering resistance at this level is anticipated, a break above could be interpreted as constructive confirmation of positive momentum.
In the chart below, we can see this price level overlaid with the MVRV ratio:

The MVRV metric adds an additional perspective here. MVRV is the ratio between the price and the cost basis and represents the unrealized profits or losses. We can see here that short-term holders were indeed sustaining some levels of potential unprofitability for a number of weeks.
The question is, then, whether outside factors contributed to a change in the outlook and sentiment from the short-term holder cohort or if these participants did in fact capitulate but the price held nevertheless.
To answer this question, we can look at profit and loss data, including the Short-Term Holder Profit/Loss Ratio Indicator and SOPR. Unlike MVRV, which gauges investor psychology and market sentiment by providing the view of unrealized profit or loss, these two indicators show us the realized aspect of the equation – i.e. whether the market participants who are spending are locking in profits or losses on their transactions.
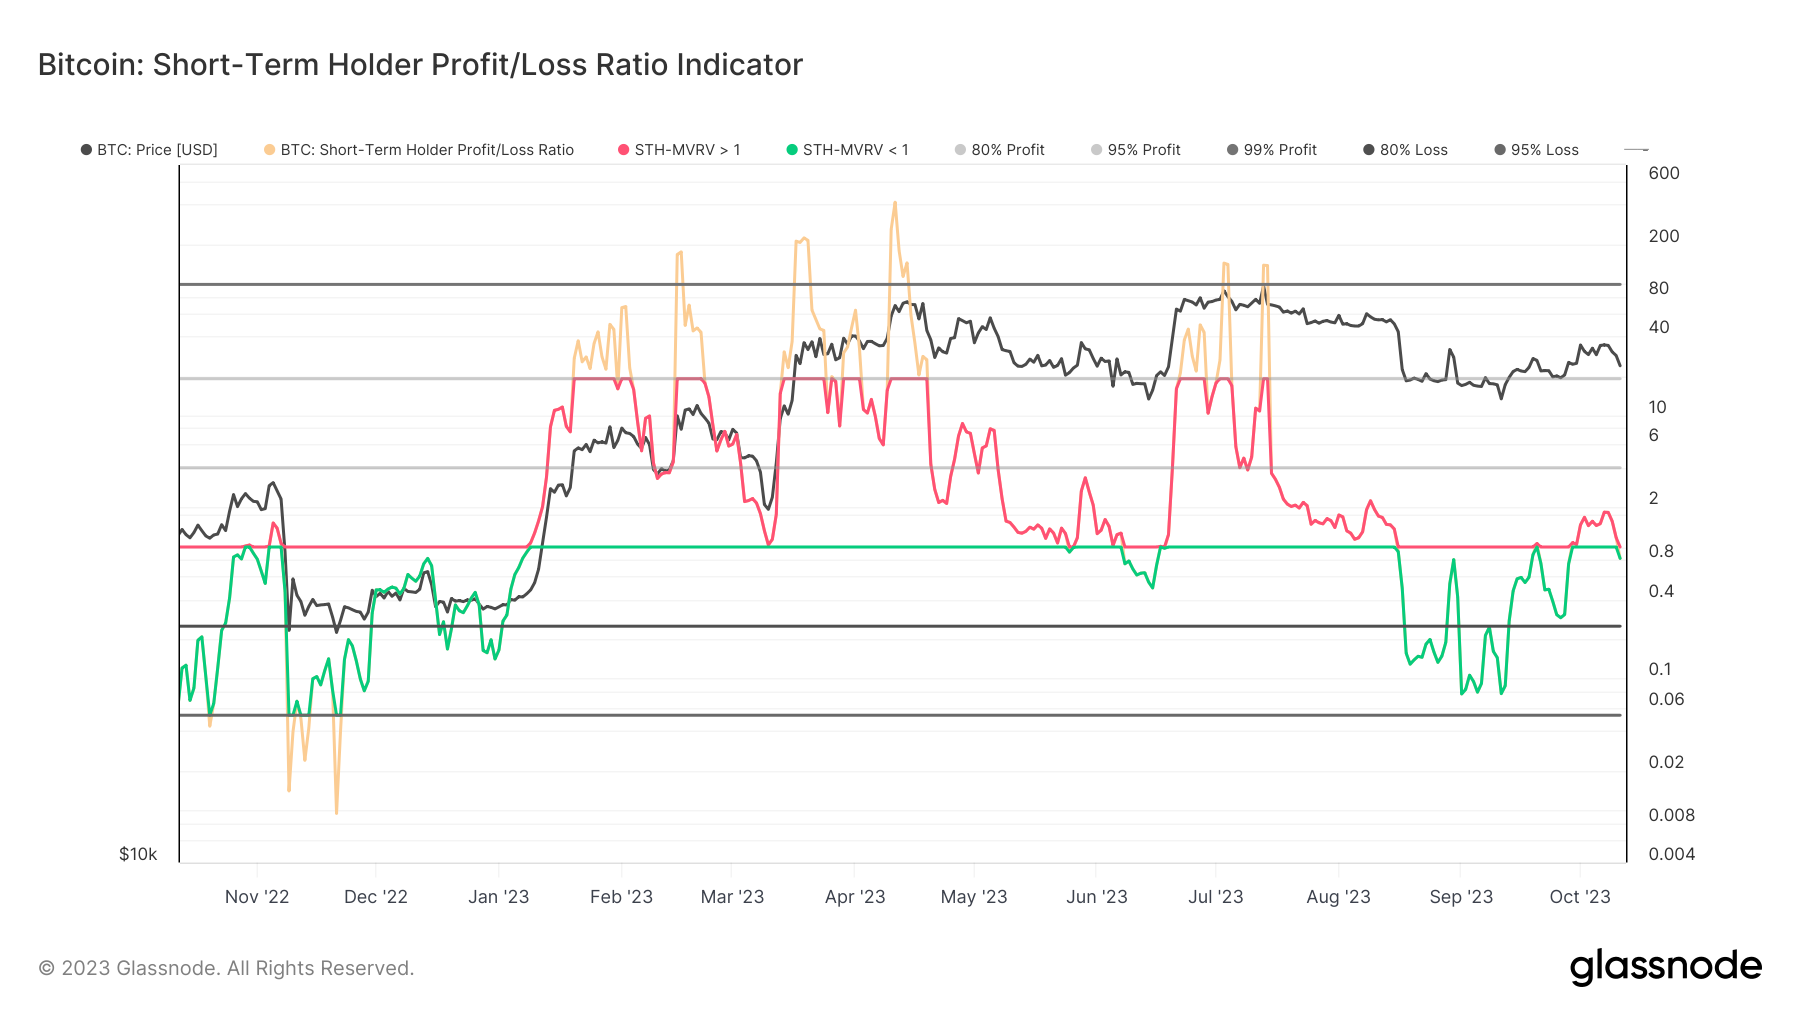
In the Short-Term Holder Profit/Loss Ratio Indicator realized losses are marked in green. We can conclude that throughout September, short-term holders did indeed lock in significant amounts of losses.
Similarly, SOPR also went into negative territory, confirming that short-term holders were realizing losses nearly on a daily basis for over a month. The last time the market experienced similar price action for a similar amount of time was around the FTX debacle.

What’s notable this time around, however, is that the price traded largely sideways during this period. Despite a visible loss-making regime and long-lasting sell-side pressure, the actual effect on the market was contained. Additionally, at the end of that loss-making regime, the market did actually manage to go into positive territory, with short-term holders back at the levels of tentative profitability.
To summarize, we can describe the current market situation as follows:
- Despite clear signs of market panic and increased selling, Bitcoin’s price remained stable and then appreciated.
- This indicates that the buying demand has been stronger than the selling pressure from short-term holders.
- It’s important to note that this is one of the most significant periods of market panic we’ve seen in over a year, with the last comparable event being the FTX incident.
In the broader context, bond markets and other financial sectors are currently unstable. Yet, Bitcoin remains steady, even in the face of significant sell-offs in the US treasury markets. This dynamic paints a surprisingly strong and resilient case for the asset. While demand appears limited, it’s met with an even greater reluctance from existing holders to sell.
These dynamics are also visible in the Exchange Volume Momentum metric which seeks to identify the macro trend shifts in exchange-related volumes, by comparing the monthly average of combined exchange inflows and outflows, to the yearly average:

Here, we note that the yearly average has been in a modest yet steady uptrend throughout the year. Additionally, we note that the 30-day average volumes are picking up after a pronounced, multi-month downtrend. The 30-day moving average has recently found support on the level drawn by the yearly average and actually printed a lower high. Thus, it continued its macro trend of making higher highs and lower lows.
In the past, when the 30-day average of exchange volumes found support on the yearly average, it often meant a continuation of the positive trend. That was especially the case in late-bear market recovery periods before a new bull run. At the same time, however, the continuation hasn’t happened yet. As such, with the 30-day and 365-day averages at the same level, the momentum can be only seen as neutral.
In any case, the metric therefore shows an uptick in exchange-related activities both in the short and long term which means more trading activity. The question remains whether this can be interpreted as a sign of demand coming from new market entrants. This is important as it could signal a revival of interest in Bitcoin as an asset and give a reason to suspect the positive trend might continue.
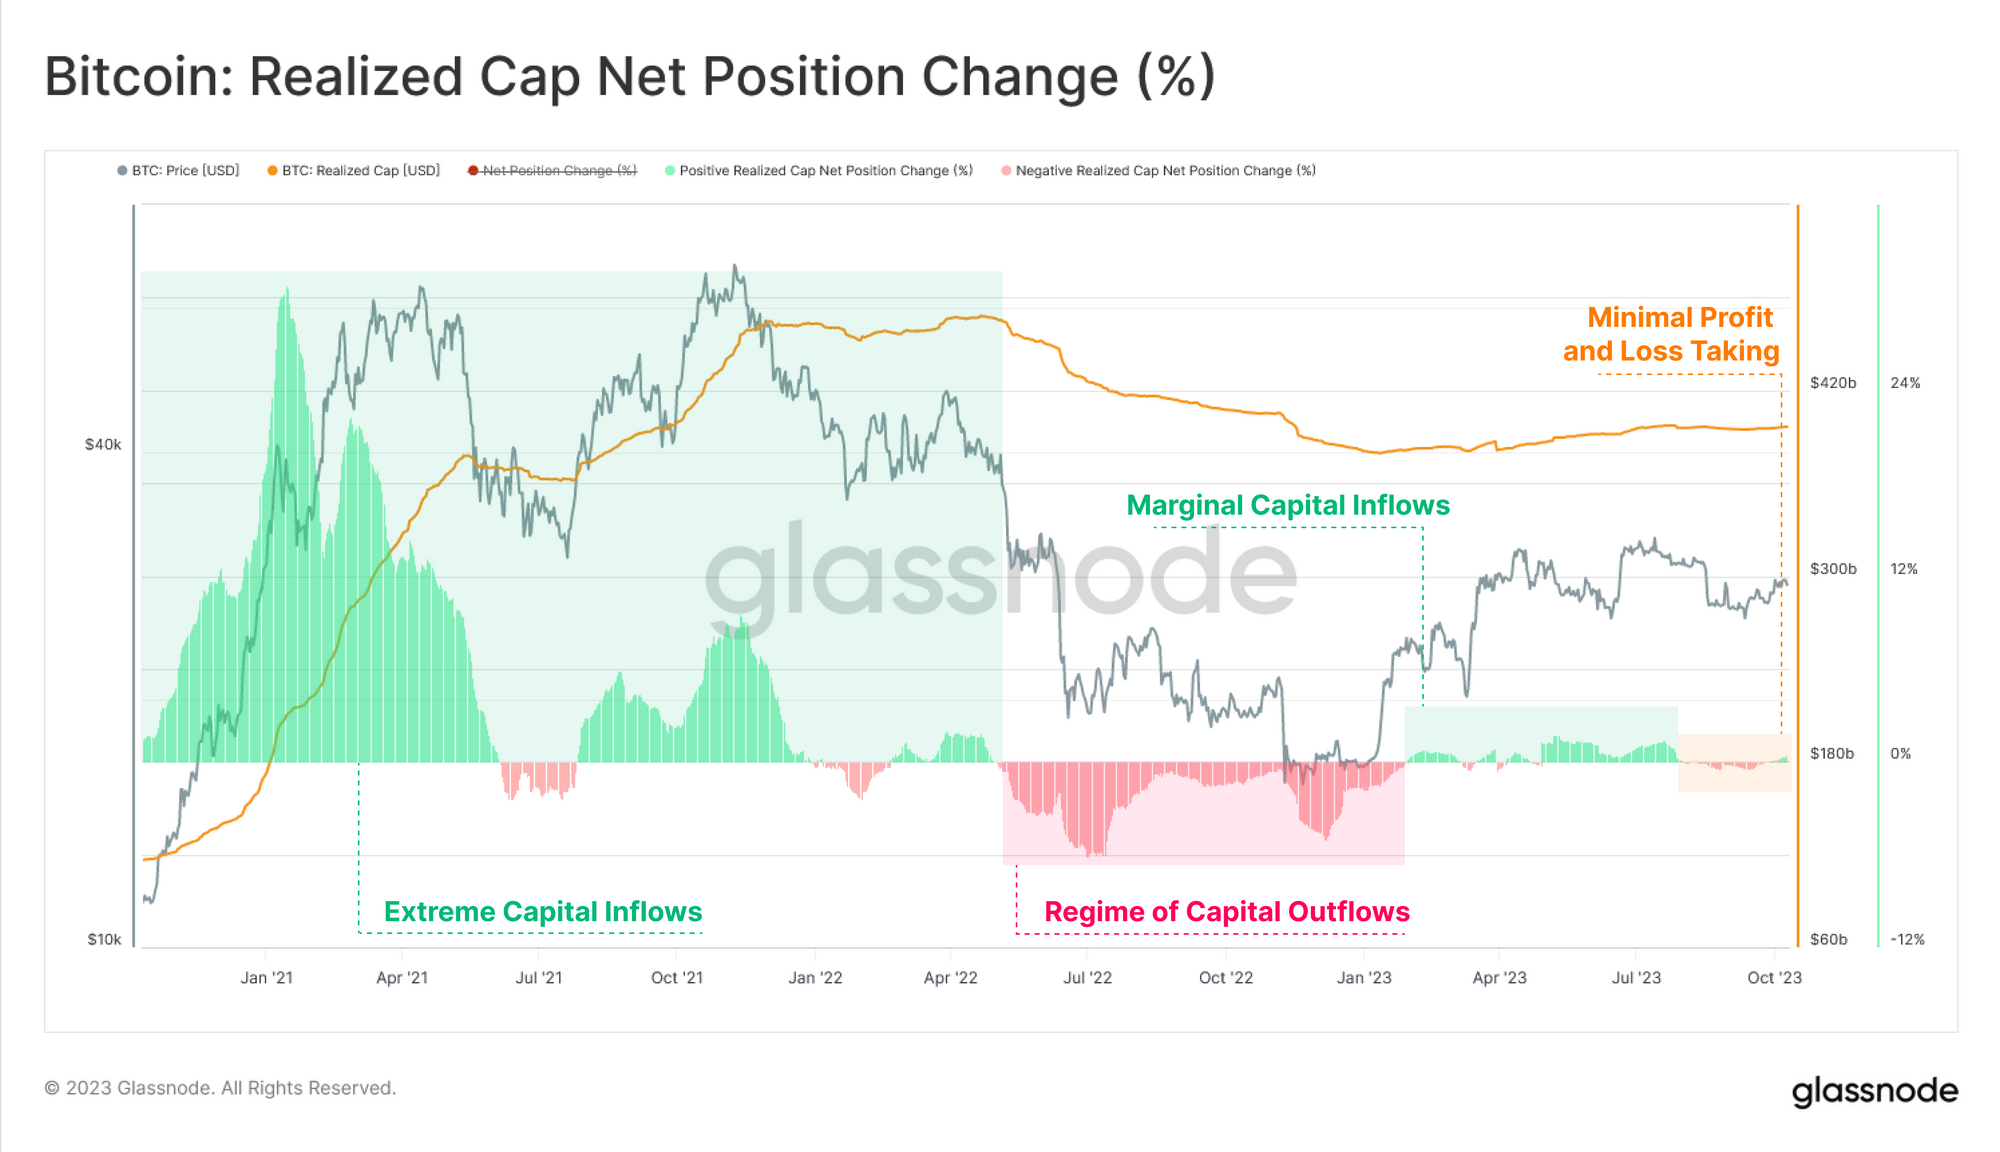
To assess this, we can use metrics that follow capital inflows into the market on the macro scale such as the Realized Market Cap. In contrast to the traditional market cap, the Realized Market Cap metric calculates the value of each coin at the time of its last on-chain movement and sums it up. This provides a better view of capital inflows than the traditional market cap which gives each coin the same weight:

While we are not seeing a robust influx of capital yet, we can see that the realized cap has recently picked up after a period dominated by capital outflow. This does indeed suggest some uptick in demand from new market entrants and is in line with off-chain data such as fund flows into institutional Bitcoin investment products like ETFs and ETPs. However, the Realized Cap metric is also signalling a host of challenges currently facing Bitcoin traders which we explore in the Risk Vectors section.
The primary risk vectors currently facing the cryptocurrency market can be categorized into three main areas: macroeconomic concerns, regulatory and reputational uncertainty, Bitcoin’s market position and liquidity as well as Bitcoin’s options trader positioning. Each of these vectors has the potential to significantly influence the trajectory of Bitcoin and other digital assets, impacting both short-term trading and long-term investment strategies.
Broader Context: Bond Market Turmoil
The global bond market is currently undergoing a significant upheaval, with the yield on 30-year US Treasuries reaching a 16-year peak. This surge in yields, which touched 4.95% for the first time since before the 2007 financial crisis, is a reaction to the anticipation of prolonged high-interest rates and substantial government borrowing. This shift has not only impacted the US but has also sent ripples across the world.
The bond market’s turbulence has been further intensified by strong economic indicators from the US and the Federal Reserve’s intention of maintaining rates “higher for longer” to combat inflation. This upheaval in the bond market has had cascading effects on global equities, currencies, and other financial instruments. While Bitcoin has shown resilience, defying the selloff in stocks and other risk assets, the broader bond market turmoil remains a looming risk for digital asset investors.
Compounding these concerns is the contracting M2 money supply, a critical indicator of economic health, which has been shrinking for the first time since 1949. This macroeconomic uncertainty has been negatively influencing Bitcoin’s recovery by stumping the flow of new capital into the space.
Bitcoin’s Market Position and Liquidity
The challenging macroeconomic landscape on the Bitcoin and broader digital asset markets has resulted in a phase of pronounced liquidity challenges. Both on-chain and off-chain activities are signalling a significant reduction in active trading and movement of assets.
This illiquidity can lead to heightened volatility, where even minor trades might cause substantial price shifts. Bitcoin’s Realized Cap of Bitcoin, indicating minimal profit or loss events, suggests a market with limited price movement opportunities, potentially stalling short-term trading strategies.
Furthermore, a substantial portion of assets is held by long-term investors or HODLers. This behaviour is tightening the available supply for trading, which, when coupled with the reduced active supply on exchanges, can lead to unpredictable price spikes if demand suddenly surges.

Such reduced activity can obscure accurate price discovery, making the market more susceptible to unexpected price swings in response to large trades or new information. In essence, traders are navigating a landscape marked by reduced liquidity, the potential for abrupt price changes, and an overarching sense of market uncertainty.
Bitcoin’s Options Trader Positioning
The potential for abrupt price changes is further reinforced by an unfolding situation in the Bitcoin options market. A detailed analysis by Galaxy Fund Management has highlighted a significant market structure divergence between Bitcoin (BTC) and Ethereum (ETH) options. Specifically, dealers are predominantly short on BTC gamma, while they maintain a long position on ETH gamma.
The short gamma position in Bitcoin can amplify Bitcoin’s price movements, especially in an upward direction. In contrast, the long gamma position in Ethereum indicates a potential stabilizing effect on its price, suppressing extreme volatility. This divergence in gamma positioning between the two leading cryptocurrencies can lead to pronounced price moves in Bitcoin, while Ethereum may experience more subdued fluctuations.
However, such positioning can also potentially translate into stronger moves to the downside if the positive price trajectory doesn’t materialise.
When dealers are short gamma, they are essentially betting on the price of the underlying asset to move in a particular direction, often upwards. As the price of Bitcoin rises, these dealers might need to buy more Bitcoin to hedge their positions, which can further push the price up, creating a positive feedback loop. This can amplify the upward price movement, leading to potentially significant gains.
The flip side of this is that if the anticipated positive price trajectory doesn’t materialize, the opposite effect can occur. If the price of Bitcoin starts to decline, dealers might need to sell Bitcoin to adjust their positions and remain delta-neutral. This selling can further push the price down, creating a negative feedback loop. The short gamma position can then amplify the downward price movement, leading to potentially significant losses.
While a short gamma position can lead to pronounced price moves upwards, amplifying gains, it can also exacerbate price drops, leading to steeper losses. This dual-edged nature makes it crucial for traders and investors to be cautious and well-informed when navigating the options market, especially in volatile assets like Bitcoin.
The MVRV Ratio, standing for Market Value to Realized Value, is a useful on-chain metric that is popular with on-chain analysts for its ability to spot macro shifts and long-term trend reversals in tradeable digital assets. Because of that, it is an important tool that every digital asset trader should have in their arsenal for enhanced decision-making based on on-chain data.
At its core, MVRV compares the current price (Market Value) of a cryptocurrency to its Realized Price (Realized Value). The Realized Price is essentially the average price at which every coin last moved on-chain. So in simple terms, MVRV compares the current price of Bitcoin to the average price at which it was last traded. This means that the MVRV ratio can be interpreted as a measure of the unrealized profit held within the supply.

Why Should Traders Care?
Here are a few of the insights that the MVRV ratio can provide:
- Spotting Market Extremes: High MVRV values (above 2.4) suggest the market is in a state of significant unrealized profit, which can be a sign of an overheated market. On the other hand, low MVRV values (below 1.0) can indicate a market in distress, potentially signalling buying opportunities.
- Identifying Market Trends: If the MVRV is consistently above its 1-year average, it’s a sign of a bullish trend. Conversely, if it’s below, the market might be bearish. This can help traders time their entries and exits.
- Early Warning Signs: A decreasing MVRV, even as prices climb, can be a red flag. It suggests that while prices are high, the average acquisition cost of Bitcoin is also rising. This can indicate a market top as early investors cash out, leaving newer investors potentially exposed to downturns.
Based on these dynamics, there are clear applications of MVRV for institutional entities engaging with the digital asset market:
- Risk Management: Use the MVRV to gauge market sentiment. A high MVRV might suggest it’s time to hedge or reduce exposure, while a low MVRV could indicate a buying opportunity.
- Strategic Entries/Exits: For asset managers and hedge funds, the MVRV can be a tool to time market entries and exits, maximizing profit and minimizing potential downturns.
- Portfolio Diversification: If the MVRV suggests Bitcoin is overheated, it might be time to diversify into other assets or cryptocurrencies.
If you would like to learn more about this metric as well as to discover its derivative indicators and the multiple ways you can learn it, Glassnode has prepared a comprehensive Dashboard. We also encourage you to deepen your understanding of this essential metric by reading this dedicated article in Glassnode Academy pages as well as this walkthrough published on our Insights page earlier this year. These resources will help you take your first steps in the world of on-chain analysis and use the insights you uncover in your day-to-day trading or risk management activities.
Get Personalised Insights
We hope that Finance Bridge continues to provide valuable insights and helps you navigate the crypto landscape more effectively.
If you have an idea about how we could improve this newsletter to make it more practical for you, we invite you to engage with us. Do you have any questions about the content of this issue or any other queries? Would you like to connect directly with our team of analysts? Or are you interested in discovering how you can leverage Glassnode’s full potential?
Don’t hesitate to reach out. Your thoughts and insights will help us continue to improve the quality of our services and this newsletter, so we’re genuinely excited to hear from you. Schedule a call with a dedicated member of our Institutional sales team to begin the conversation.
Disclaimer: This report does not provide any investment advice. All data is provided for information and educational purposes only. No investment decision shall be based on the information provided here and you are solely responsible for your own investment decisions.

- SEO Powered Content & PR Distribution. Get Amplified Today.
- PlatoData.Network Vertical Generative Ai. Empower Yourself. Access Here.
- PlatoAiStream. Web3 Intelligence. Knowledge Amplified. Access Here.
- PlatoESG. Carbon, CleanTech, Energy, Environment, Solar, Waste Management. Access Here.
- PlatoHealth. Biotech and Clinical Trials Intelligence. Access Here.
- Source: https://insights.glassnode.com/finance-bridge-edition-5/

