Your gateway to successful crypto investing guided by data and research
Key Takeaways
- On-Chain Basics – UTXOs: Blockchains operate mainly via two systems: UTXO-based (like Bitcoin) that use a “melt-and-mint” approach, and account-based (like Ethereum) that adjust direct account balances. UTXOs can be thought of in terms of the gold coin analogy, serving as base units for coin ownership.
- On-Chain Basics – URPDs: The UTXO Realized Price Distribution (URPD) tool offers a deep dive into market dynamics, illuminating investor sentiment, transaction history, and pivotal market points by mapping Bitcoin supply based on the last transacted price.
- Market Momentum: Current URPD data segments Bitcoin participants into three main zones: the steadfast holders below $15k, the mix of new accumulators and traders from $15k-$30k, and the recent 2021-22 bull run entrants above $30k. Essential URPD findings also spotlight a market midpoint at $30k, with notable demand below and uncharted territory area above, potential sell-side pressure risk within the $28k-$31k bracket, and a pronounced ‘value zone’ spanning $15k to $25k.
July marked a pivotal moment for Bitcoin as it reached the midpoint of the 2021-22 cycle. The month was characterized by a re-accumulation phase, with inscriptions waning but monetary transactions on the rise. Despite reaching a temporary yearly high of $31.7k, the market remained relatively muted, echoing the restrained trading conditions reminiscent of 2016 and 2019-20.

While capital inflows into digital assets were steady, yet the market’s overall volatility saw a significant dip, with tight trading ranges and volumes hitting all-time lows. The volatility compression suggests a market that’s largely holding onto its gains, where corrections are subdued by rather robust demand.
In a market characterized by consolidation and ambiguity, anticipating the market’s next big move is crucial for positioning and risk management. On-chain analysis offers a lens into potential trajectories, but leveraging it effectively requires a good grasp of its foundational concepts. In this edition of the Finance Bridge, we will explore one such concept which is essential for understanding blockchain transaction dynamics – Unspent Transaction Output, or UTXOs.
UTXOs as Digital Gold Coins
UTXOs, though a critical component of Bitcoin’s architecture, might feel a step removed from traditional finance. Let’s dig a little deeper and try to demystify it using an asset that’s almost as old as civilization itself: gold coins.
Imagine you’re handed a 1.5-ounce gold coin. It’s solid, tangible, and discrete in its weight. If you intend to buy something that costs 0.2 ounces of gold. You might try to chip off a piece of your coin – but that would be impractical. Instead, you’d likely have the entire 1.5-ounce coin down melted down. From this molten gold, you – or, rather, a goldsmith – can create a new 0.2-ounce coin for the vendor, a 1.299-ounce coin is returned to you as change. What about the tiny 0.001-ounce bit? It taken as a fee by the one handling the melt and mint process.
On the Bitcoin network, that 1.5-ounce gold coin is your UTXO. Spending a portion doesn’t mean dividing the original UTXO, but rather “melting” it down and “minting” new ones. The original 1.5 BTC UTXO is consumed, two new UTXOs (0.2 BTC & 1.299 BTC) emerge, and a transaction fee is taken, analogous to the operator of our fictional gold mint.
Now, you might be wondering why this melt-and-mint process even matters? The nuances of UTXOs play a crucial role in on-chain analysis:
- History’s Imprint: Each UTXO (our gold coin) carries a timestamp – equivalent to the minting date. By observing when both the timestamp and lifespan of a UTXO – when a gold coin is created and when it’s melted down – analysts can deduce various behaviours of market participants. For example, a 10-year-old UTXO that hasn’t been spent is likely either lost or securely tucked away, perhaps in a digital equivalent of Fort Knox. The takeaway? Its influence on the current market dynamics will likely be limited.
- Signs of the Times: On the other hand, a sudden spike in old UTXOs being spent can suggest that the long-term Bitcoin holders are cashing in their chips. Perhaps they foresee a market shift or want to cash in on high prices, making it a potential signal for market sentiment – or even a reversal from bull to bear.
- The Profit Trail: Apart from the “minting date”, Each UTXO carries its purchase price. When it’s spent, comparing its original and current value reveals the profit or loss. This gives insights into overall investor standing, allowing analysts to gauge if the market is bullish or bearish based on realized profits or losses.
- Big Players, Bigger Patterns: Large financial entities, like major exchanges, often exhibit unique UTXO management patterns. Spotting these patterns allows for predictions on significant market movements or shifts, as these entities have substantial influence.
By studying the unique properties of UTXOs, trained analysts and experienced market participants can gain insights on everything from ownership and network activity to investor sentiment and market cycles. Some of the critical metrics that are possible thanks to the UTXOs accounting system include:

Each of these metrics, while distinct, taps into the foundational concept of UTXOs to draw insights and interpretations about the broader market behaviour. In essence, while UTXOs might be Bitcoin’s backbone, understanding them is key to deciphering the blockchain’s heartbeat.
Diving deeper into the granularity of UTXOs, UTXO Realized Price Distribution bars, or URPDs, map out the price at which each UTXO was last moved, creating a distribution of realized prices which provides a lot of information about the current state of the market.
Think of it as a histogram of Bitcoin’s supply sorted by the price at which coins were last transacted. It provides a vivid snapshot of investor sentiment, showing at which price levels most investors moved their coins and potentially indicating strong support or resistance areas. When a large portion of UTXOs have a realized price at certain levels, it can signify collective points of entry or exit in the market.
URPDs and the Stockholder’s Cost Basis Analogy
In traditional stock markets, imagine if you could visualize a graph showcasing the exact price levels at which all shareholders bought their stocks. This would give you a tangible sense of the average “cost basis” of all stockholders.
For instance, if a significant number of investors purchased a stock at $50, and its current price is $70, you’d expect strong resistance from these shareholders to sell below $50 since it represents their initial investment. This price level becomes a psychological benchmark, a point of potential support, because a drop below this would signify a loss for a considerable portion of investors.
URPDs in the crypto world offer a similar perspective for Bitcoin. By mapping out the last transacted price of each UTXO, URPDs reveal the equivalent of this “cost basis” for Bitcoin holders. It’s a bit like having that stock purchase chart, but for the decentralized world of cryptocurrencies. Just as shareholders are less likely to sell below their purchase price, Bitcoin holders may be less inclined to part with their assets below the price at which they moved (or possibly acquired) their coins.
Glassnode’s Unique Spin on URPDs
Diving into UTXO Realized Price Distribution (URPD), it’s critical to appreciate its nuance, dimensionality, and precision in painting the market landscape. At Glassnode, our URPD analysis employs various lenses, each sharpening our understanding of the market momentum. It’s akin to having an array of sophisticated microscopes, each specialized for distinct facets of a complex subject.

1. UTXO Realized Price Distribution (URPD): ATH-Partitioned
Imagine Bitcoin’s journey to its highest peak, divided into 100 even steps. This URPD representation captures the Bitcoin UTXO at each of these steps. Essentially, it gives us a clear view of where most Bitcoins last changed hands on their ascent to the all-time high.

2. UTXO Realized Price Distribution (URPD): Percent-Partitioned
Now, let’s change our perspective. Instead of focusing on the journey to the peak, this lens examines the ebb and flow around the current price. By dividing the closing price space into 50 buckets both above and below, in increments of 2%, we get a sharp snapshot of the immediate market sentiment.

3. Entity-Adjusted URPD
The Bitcoin network is vast, with countless transactions, but not every transfer signifies genuine buying. Here, we fine-tune our lens. By ignoring mere address-to-address movements under the same entity and excluding the massive pooled supply on exchanges, this metric offers a more authentic picture, centered on true purchase events.
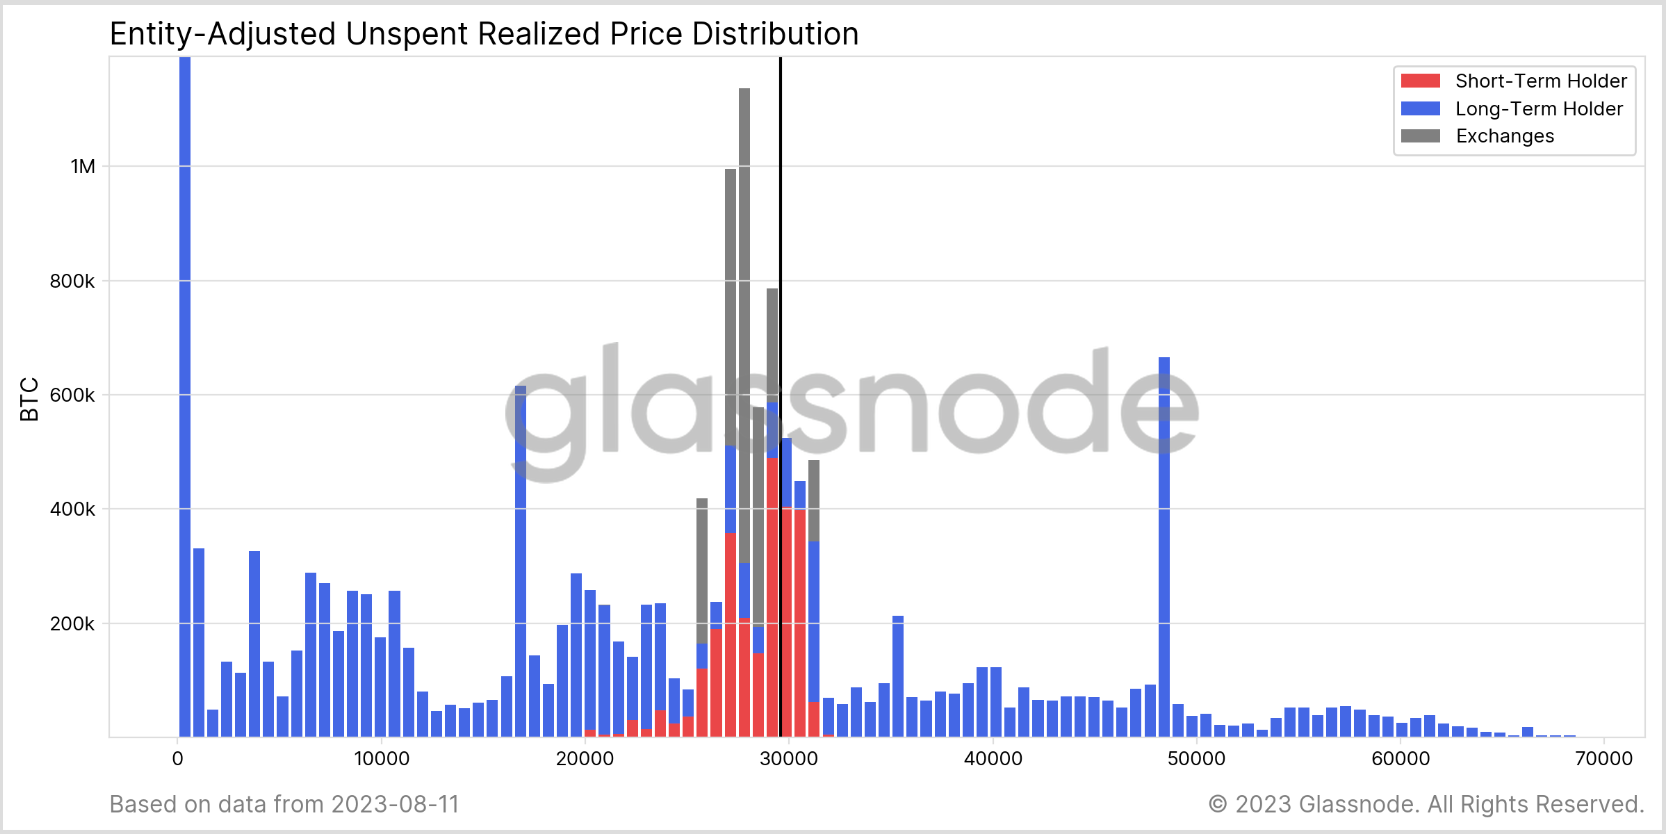
4. Entity-Adjusted URPD by Long- and Short-Term Holders
This is where the plot thickens. Segmenting supply by the duration of holding – long-term (reminiscent of those who weather the storms) in blue, and short-term (the agile movers and shakers) in red, with exchange balances in grey, offers a multi-dimensional map. It’s not just about the last transaction price; it’s about who’s holding at that price, shedding light on potential market behaviours.
Just as an orchestra requires multiple instruments for a symphony, understanding Bitcoin’s market pulse necessitates these varied URPD metrics. Now, let’s delve into what these instruments reveal about the current market momentum.
The Three URPD Zones: A Market Synopsis
UTXO Realized Price Distribution (URPD) illustrates the market’s momentum and decisions made by its participants. These distributions form distinct zones, each shedding light on the market’s condition. Let’s delve into what these zones reveal.
Below $15k: The Legacy of Multi-Cycle HODLers
This zone is home to Bitcoin’s veterans: the multi-cycle HODLers. Historically, this cohort has held onto their coins through thick and thin, displaying unwavering belief in Bitcoin’s long-term potential. These holders typically start spending once the market surges to new All-Time Highs (ATHs). Their activity suggests a seasoned strategy, where they may capitalize on peak valuations. Refer to this paper for a comprehensive breakdown of their behaviour.
Between $15k and $30k: The Diverse Midfield of Accumulators and Traders
This segment encapsulates a rich tapestry of market participants active over the last year. On one end, you have the persistent accumulators. These are the savvy players who sensed value during the bearish tides and significantly contributed to establishing the market’s floor. Their conviction is mirrored by the ‘blue’ zone in the URPD Engine Room variant, showcasing HODLers who braced the market’s turbulence.
On the flip side, in the ‘red’ zone of Glassnode’s Entity-Adjusted URPD by Long- and Short-Term Holders chart, you spot the traders. Agile and opportunistic, they’ve leveraged the 2023 rally, ensuring liquidity and keeping the market dynamic. Their actions are less about long-term conviction and more about short-term gains. We explored these dynamics in more detail in the first edition of Finance Bridge.
Above $30k: The 2021-22 Top Buyers—Navigating the Choppy Waters
Here, we find the recent entrants from the 2021-22 cycle—holders who might be nursing unrealized losses. As the market strives to climb, these holders can turn into potential resistance points. Why? The pain of unrealized losses may push many to offload their holdings as soon as they break even, creating a supply pressure whenever the market nears their entry points.
Gleaning Momentum from the URPD Landscape
It is evident, then, that analyzing the URPD unveils crucial price thresholds that signal market sentiments and potential shifts. Here are some of the most important conclusions that the current URPD landscape enables us to draw about the current market conditions:
- The Crucial $30k Midpoint: This price point stands as a pivotal marker. Below it, we see large URPD clusters, indicative of significant demand, underlining the market’s robust foundation. Above this, the landscape is relatively uncharted. While demand subsides, we also encounter ‘trapped holder resistance’—holders eager to mitigate losses or break even.
- The Potential Downside Risk: A notable cluster of Short-Term Holder supply is evident between $28k and $31k. It’s slightly ‘top-heavy’, suggesting that there’s potential downside risk. These holders, especially if they’re majorly traders, can create selling pressure, tipping the market dynamics momentarily.
- The $15k to $25k Value Zone: A sizeable chunk of coins nestled within this range cements it as a ‘value zone’. If market prices were to dip, this region could witness renewed interest, with investors potentially viewing it as a value buy, thereby providing robust support.
In summary, URPDs weave a comprehensive narrative of market momentum. By understanding the nuances hidden in these distributions, investors and traders can anticipate potential market moves, capitalizing on opportunities and safeguarding against potential downturns. The key is to not just see these zones but to understand the sentiment and strategies fueling them.
In Conclusion
Blockchain technology operates under two predominant systems: UTXO-based and account-based. Account-based blockchains, such as Ethereum and Cardano, operate similarly to traditional banks, adjusting balances directly in accounts for transactions. In contrast, UTXO-based systems like Bitcoin employ a “melt-and-mint” approach, using unspent transaction outputs (UTXOs) as base units for coin ownership. By using the gold coin analogy, we illustrate the function of UTXOs in cryptocurrency transactions.
The unique attributes of UTXOs offer invaluable insights into market behaviours, history, sentiment, and movements. Such an analysis can be enhanced by leveraging the UTXO Realized Price Distribution (URPD) and its variations to provide a comprehensive understanding of market momentum. Using URPDs, we can effectively map Bitcoin’s supply by the last transacted price, shedding light on investor sentiment and potential market pivot points.
Currently, URPDs divide Bitcoin market participants into three zones: those below $15k are long-term stalwarts, the $15k to $30k range consists of recent accumulators and traders, and above $30k are 2021-22 cycle holders potentially sitting on unrealized losses. Key URPD insights highlight a pivotal market foundation below $30k, a potential downside risk between $28k and $31k, and a ‘value zone’ from $15k to $25k.
Get Personalised Insights
We appreciate your continued engagement with our Finance Bridge newsletter. Our hope is that this issue, centred around the pivotal concepts of UTXOs and URPDs, has provided you with valuable insights into the dynamics of the cryptocurrency market.
To better serve your needs, we encourage you to connect with us. Should you have any questions about the content of this issue or if you’re interested in exploring how to harness Glassnode’s full potential, we’re here to assist.
Please feel free to reach out. Schedule a call with a member of our Institutional Sales team to initiate a conversation. We earnestly look forward to your invaluable insights.
Disclaimer: This report does not provide any investment advice. All data is provided for information and educational purposes only. No investment decision shall be based on the information provided here and you are solely responsible for your own investment decisions.

- SEO Powered Content & PR Distribution. Get Amplified Today.
- PlatoData.Network Vertical Generative Ai. Empower Yourself. Access Here.
- PlatoAiStream. Web3 Intelligence. Knowledge Amplified. Access Here.
- PlatoESG. Automotive / EVs, Carbon, CleanTech, Energy, Environment, Solar, Waste Management. Access Here.
- PlatoHealth. Biotech and Clinical Trials Intelligence. Access Here.
- ChartPrime. Elevate your Trading Game with ChartPrime. Access Here.
- BlockOffsets. Modernizing Environmental Offset Ownership. Access Here.
- Source: https://insights.glassnode.com/finance-bridge-edition-3/

