Your gateway to successful crypto investing guided by data and research
Executive Summary
- Monthly Overview: February 2024 saw Bitcoin’s market surge, driven by positive momentum, substantial price gains, and new capital influx, notably through the U.S. spot Bitcoin ETFs like BlackRock’s IBIT. Record ETF inflows and a reduced supply at loss reflect a bullish investor sentiment, while speculation and strategic long-term holder distributions suggest a balanced yet speculative market landscape.
- Market Momentum: March continued February’s strong positive momentum, pushing Bitcoin to new heights before encountering downside volatility and significant liquidations. Long-term holder profit-taking and the upcoming Bitcoin halving suggest a period of increased market strength and volatility, offering a blend of risk and opportunity for traders.
- Metric Spotlight: The SLRV Ribbons metric, comparing short-term Bitcoin transactions to long-term holdings, serves as a key indicator of market momentum shifts. High SLRV Ratios signal fresh capital inflows, while low ratios hint at a solidifying long-term holder base.
This month’s Finance Bridge report focuses on the recent trends in the Bitcoin market, highlighting its strong momentum, significant volatility, and the impact of long-term holder activities. We cover Bitcoin’s new all-time high, key drivers of market volatility, and the influence of the Bitcoin halving cycle on market performance, providing traders with insights on navigating these developments.
Monthly Market Overview
February in the digital asset market was marked by a growing positive momentum, fairly rapid price appreciation, risk-on sentiment, and an influx of new capital.
Bitcoin soared past $60,000, marking the largest monthly candle in its history with approximately a $20,000 increase. This rally was significantly buoyed by the spot Bitcoin ETFs in the U.S., particularly BlackRock’s IBIT, which saw record inflows, amassing over $10 billion in assets under management and marking it as one of the fastest ETFs to reach this milestone.
Additionally, the volume of supply held at a loss dwindled to just 13%, which translates into improving sentiment across the investor spectrum. The Realized Cap of Bitcoin has ascended to more than $480B, signalling a robust and healthy inflow of capital, with the market nearly recouping its ATH (Read more).
The largest digital asset by market cap has also witnessed its fair share of speculative fervour, as evident from the increased exchange inflow volumes and the high open interest in futures and options markets. Directional short-sellers have placed bets against the uptrend, resulting in significant liquidations. This speculation spans both directions, showcasing a heightened risk appetite among Bitcoin investors (Read more).
As Bitcoin approaches its ATH, Long-Term Holders (investors who have held to their coins for at least 155 days) have initiated a distribution cycle, marking a transition phase where profits are increasingly being locked in. This behaviour aligns with historical patterns observed during market tops, where long-term holders begin to distribute as prices near or surpass previous highs. Notably, the new US Spot ETFs have played a crucial role in sustaining demand, offsetting the sell-side pressure from these distributions and underpinning Bitcoin’s price resilience (Read more).
The market’s momentum has also been influenced by a noticeable shift in investor capital towards more speculative assets, with a growing appetite for moving capital further out on the risk curve. Even though Bitcoin and Ethereum still lead in terms of YTD gains (and market dominance), the rotation of capital towards altcoins is discernable, albeit concentrated in higher market cap assets for now such as Solana, Polkadot, and Cosmos ecosystems. This diversification of investor interest hints at a maturing market ready to explore beyond the established giants of the cryptocurrency world (Read more).
In summary, February 2024 captures a market characterized by strategic institutional entries, a healthy capital inflow indicated by the Realized Cap’s rise, and a strategic balance between speculation and long-term holding behaviours. As the market edges closer to significant events like the Bitcoin halving, traders, particularly those focused on momentum and directional strategies, should monitor these trends for opportunities.
March kicked off by extending the strong positive momentum observed in February, propelling Bitcoin past its previous all-time high. This milestone, however, was followed by significant volatility, marked by sharp pullbacks and extensive liquidations exceeding $1 billion. It’s important to note that at market peaks, leveraged long positions often face liquidation due to intraday volatility. Conversely, directional short-sellers frequently encounter significant losses during market recoveries. This dynamic underscores the potential for profit in this market, as well as the challenges in navigating volatility as we approach the price discovery phase of the current market cycle.
We also note that the sell-side pressure at the ATH came, unsurprisingly, mostly from Bitcoin long-term holders. These investors typically hold assets over extended periods (at least 155 days), with an eye on long-term gains. Amid the volatility, these holders took profits, adjusting their positions in response to the market’s fluctuations.
The backdrop of this volatility is the Bitcoin halving cycle, which historically contributes to market performance, particularly in the second half of the year. The halving, a pre-programmed event that reduces the reward for mining new blocks by half, tends to introduce both increased volatility and market strength. Historical patterns suggest that downturns in halving years are generally limited to around -10%, offering a mix of risk and opportunity for traders. For foundational insights into Bitcoin halving, this comprehensive guide is an essential resource.
To assist directional traders, particularly those employing trend or momentum strategies, in this complex landscape, Glassnode has developed two exploratory frameworks for assessing market momentum and risk levels. These tools are crafted to help traders pinpoint strategic entry and exit points, identify market inflexion points, and gauge the strength of ongoing trends.
Market Momentum and Risk Assessment Frameworks
The Market Momentum and Risk Assessment frameworks utilize Glassnode data to identify sustained periods of market momentum and potential reversal points. Designed for investors and analysts, this approach helps navigate market complexities by highlighting opportunities during positive momentum phases and identifying risks that could lead to significant drawdowns.
These frameworks serve as complementary analytical tools for examining Bitcoin’s market dynamics. While targeting distinct objectives, they align on critical analytical aspects, providing a unified view of market trends and risk factors. Although the frameworks are grounded in historical data and haven’t been subjected to out-of-sample verification, the frameworks systematically analyze Bitcoin market activities across four key dimensions:
- Network Activity: Evaluates network usage and adoption rates to identify growth phases and assess demand. High activity levels can indicate strong market momentum, while shifts in demand, as evidenced by transaction fees and block space competition, can signal changing risk levels.
- Market Profitability: Focuses on the unrealized profits and losses of investors, offering clues about the market’s condition. Sustained increases in unrealized profits can suggest positive momentum, whereas significant profit-taking by short-term holders might elevate risk levels.
- Spending Behaviour: Analyzes the spending patterns of market participants, particularly short-term and long-term holders. This helps in understanding whether current demand can absorb profit-taking and whether investor behaviour is indicative of market tops (high risk) or bottoms (low risk).
- Wealth Distribution: Studies how wealth is distributed among new and long-standing market participants to infer investor sentiment. Shifts in wealth distribution can highlight periods of accumulation or distribution, impacting both market momentum and perceived risk.
For a full explanation of the market momentum framework, please refer to the comprehensive reports you can find here and here.
Risk Assessment Check-In
February Video Update of Risk Assessment Framework
For the comprehensive update on the current risk level in the Bitcoin market, we invite you to explore our Risk Assessment Dashboard in Glassnode Studio (available to Enterprise users). Here is the most recent update on a few selected metrics related to market profitability and spending behaviour:
Net Unrealized Profit/Loss (NUPL)
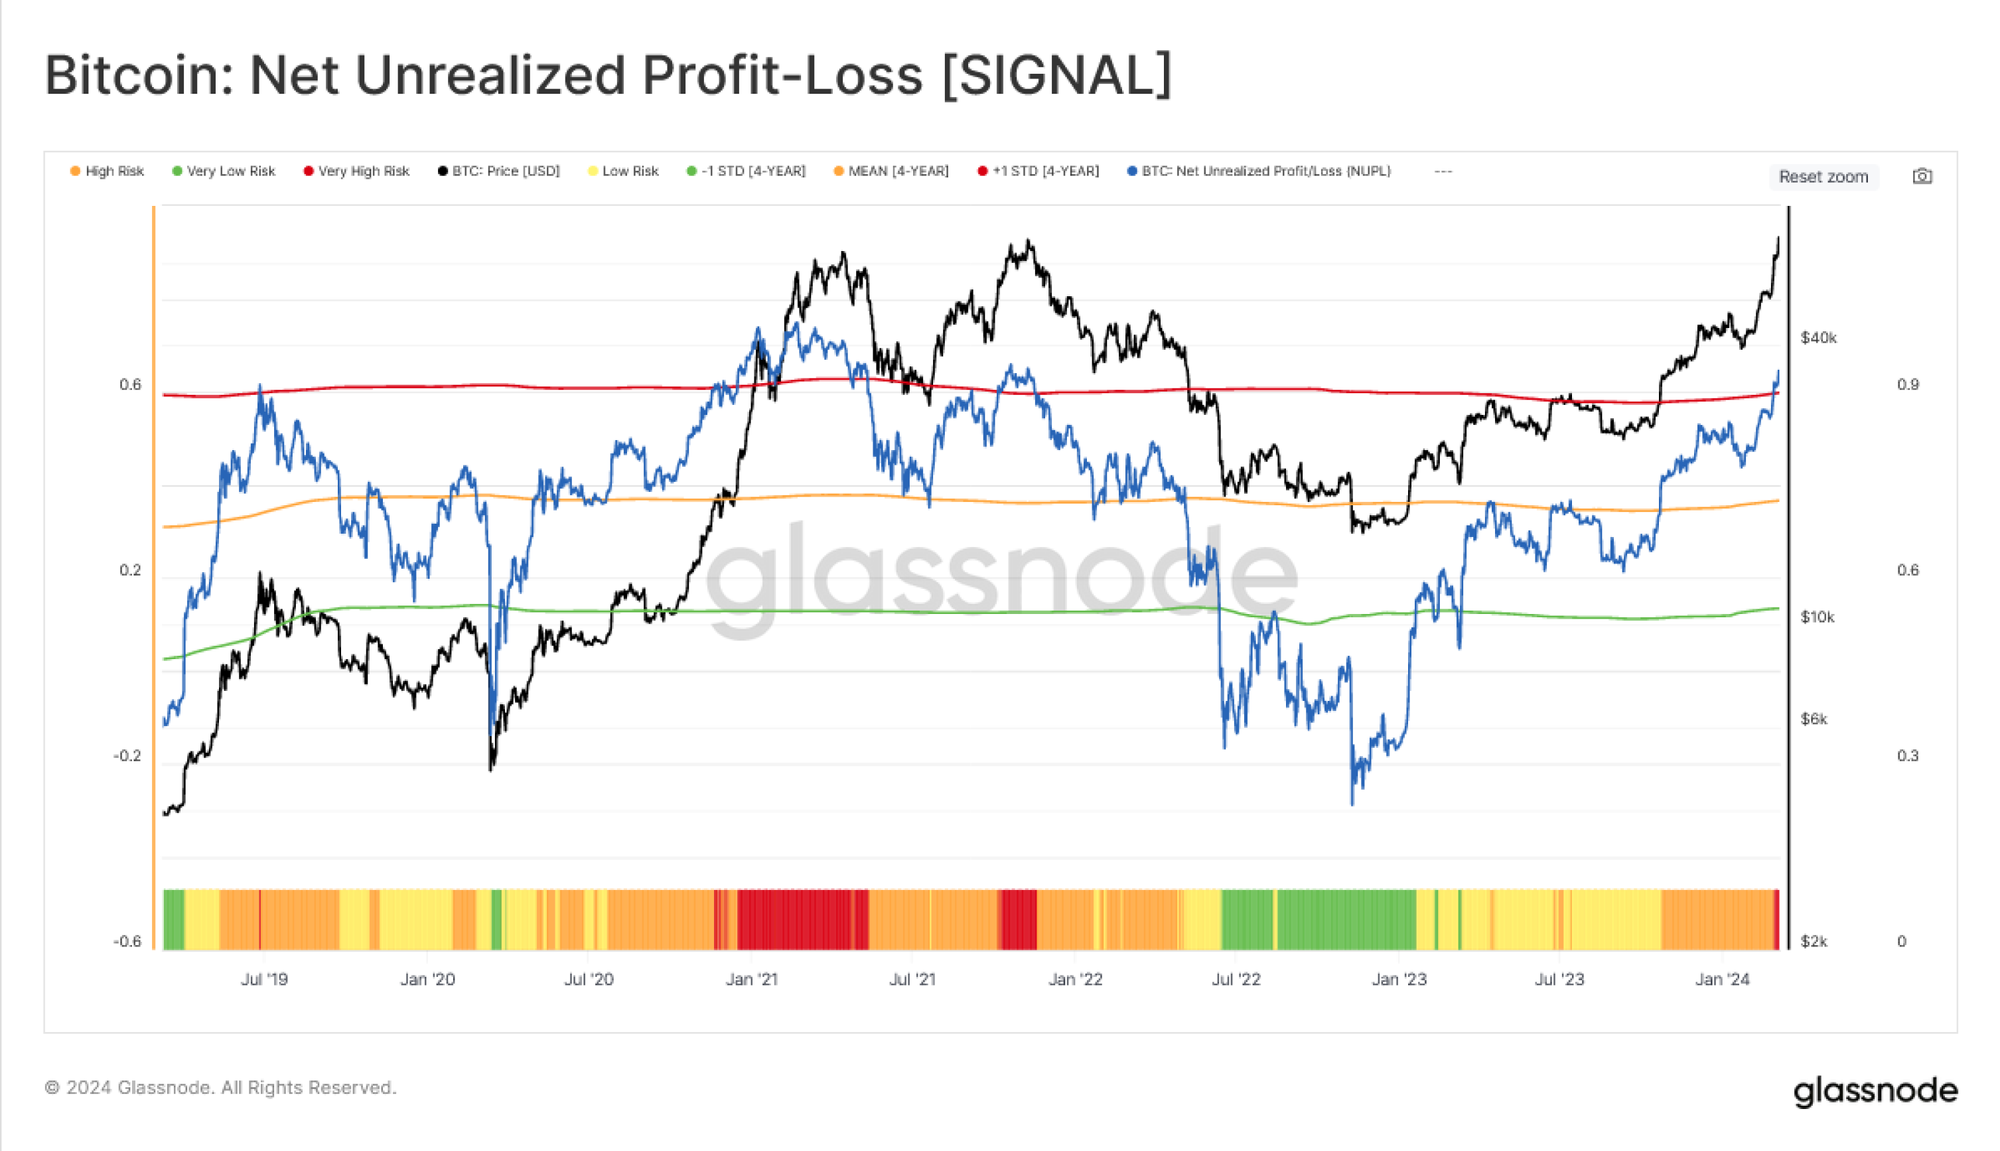
NUPL indicates whether market sentiment leans towards Fear or Greed. With a current value of 0.64, this indicator is above the +1 STD (~0.59) band, showing a VERY HIGH-RISK state in the market which is known as Euphoria.
Realized Profit/Loss (RPLR)

RPLR at 24.1, significantly above the very high-risk level of 9, suggests over 95% of BTC moved in profit, pointing to potential market demand exhaustion. Usually, a major spike into the VERY HIGH-RISK range hints at an increased pullback risk.
Long-Term Holder MVRV (LTH-MVRV)
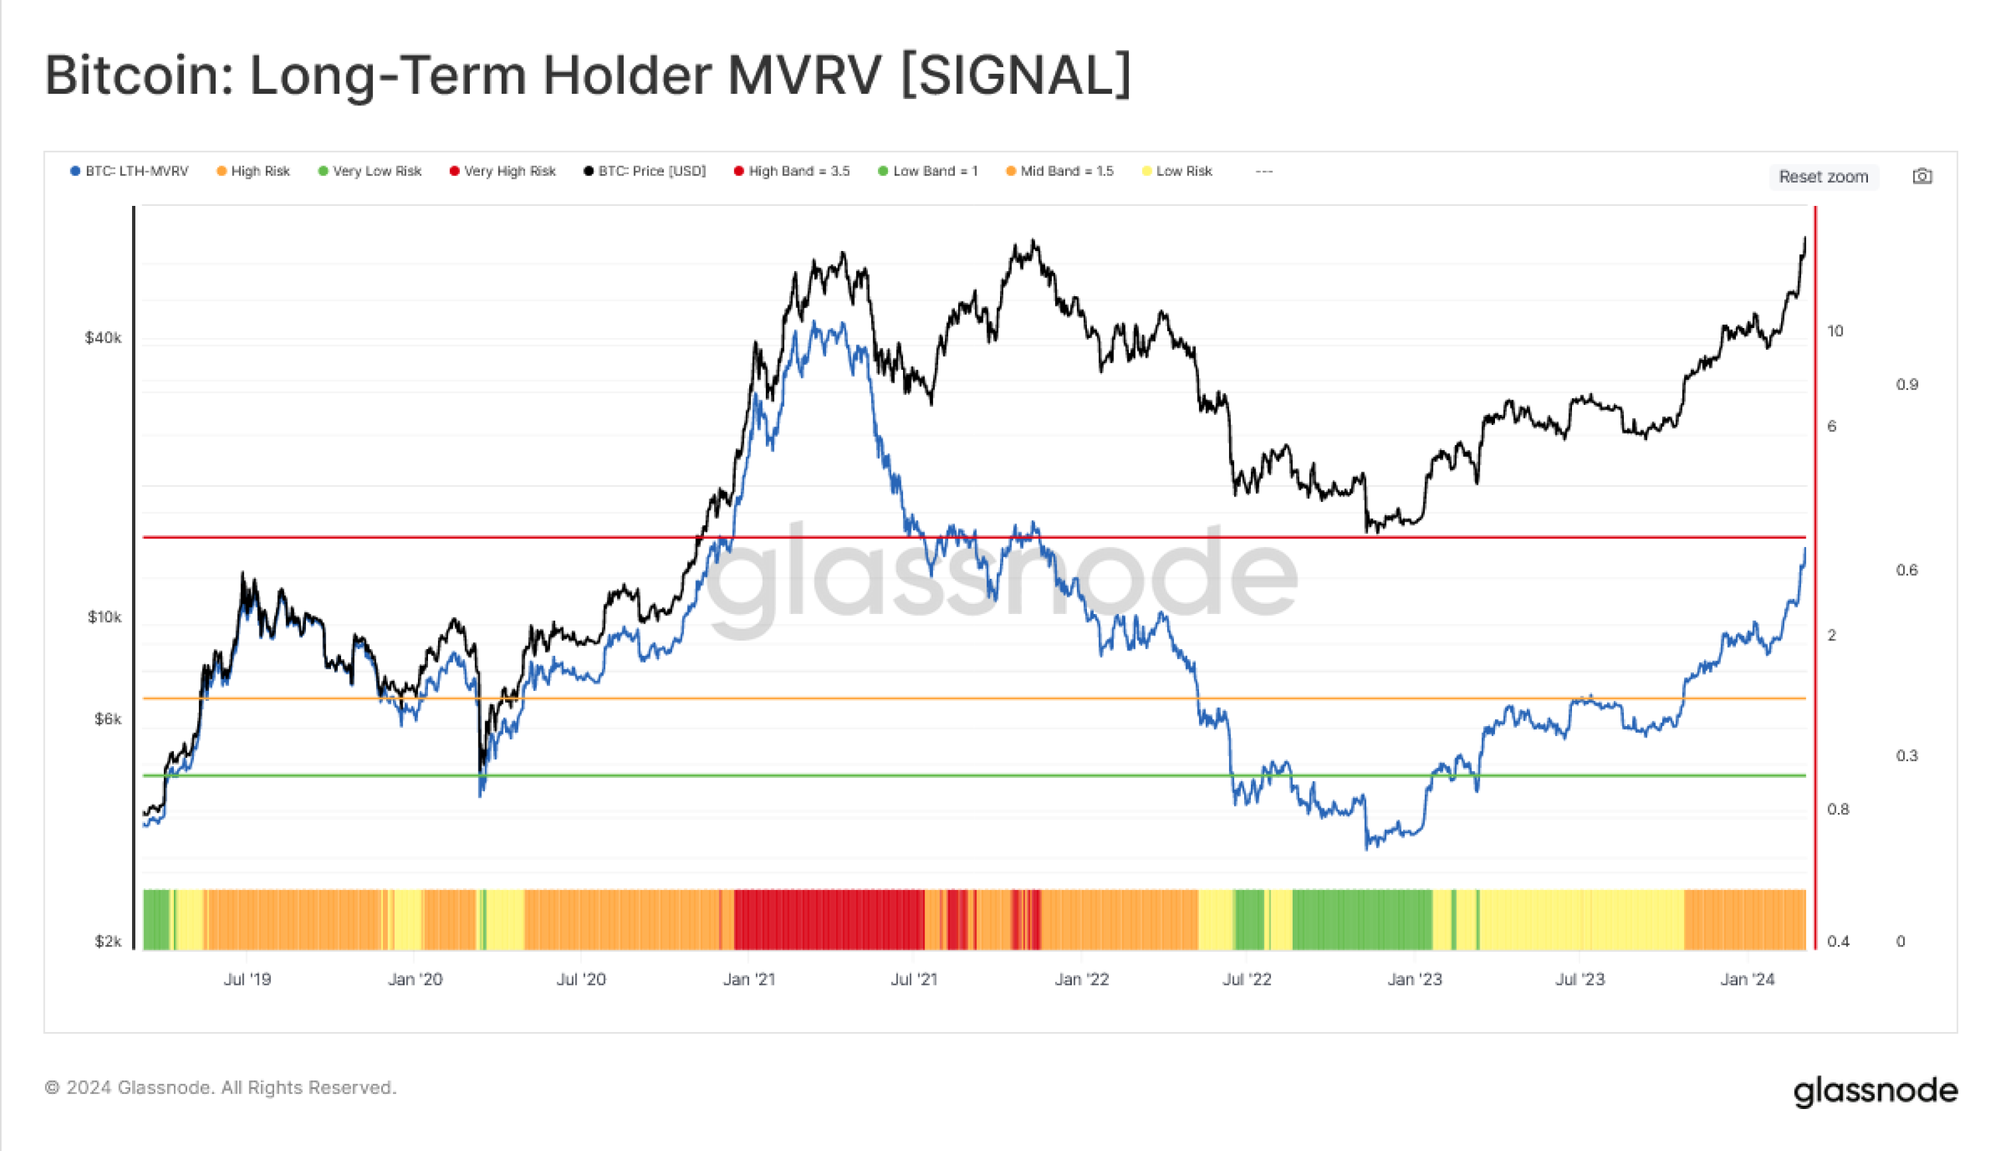
LTH-MVRV holds steady at nearly 3.3, signalling long-term holders are still in a HIGH-RISK territory but very close to the Euphoria phase (LTH-MVRV > 3.5). The recent price sharp expansion has led to a huge surge in the so-called diamond hands’ unrealized profit.
Short-Term Holder Supply Profit/Loss Ratio (STH-SPLR):
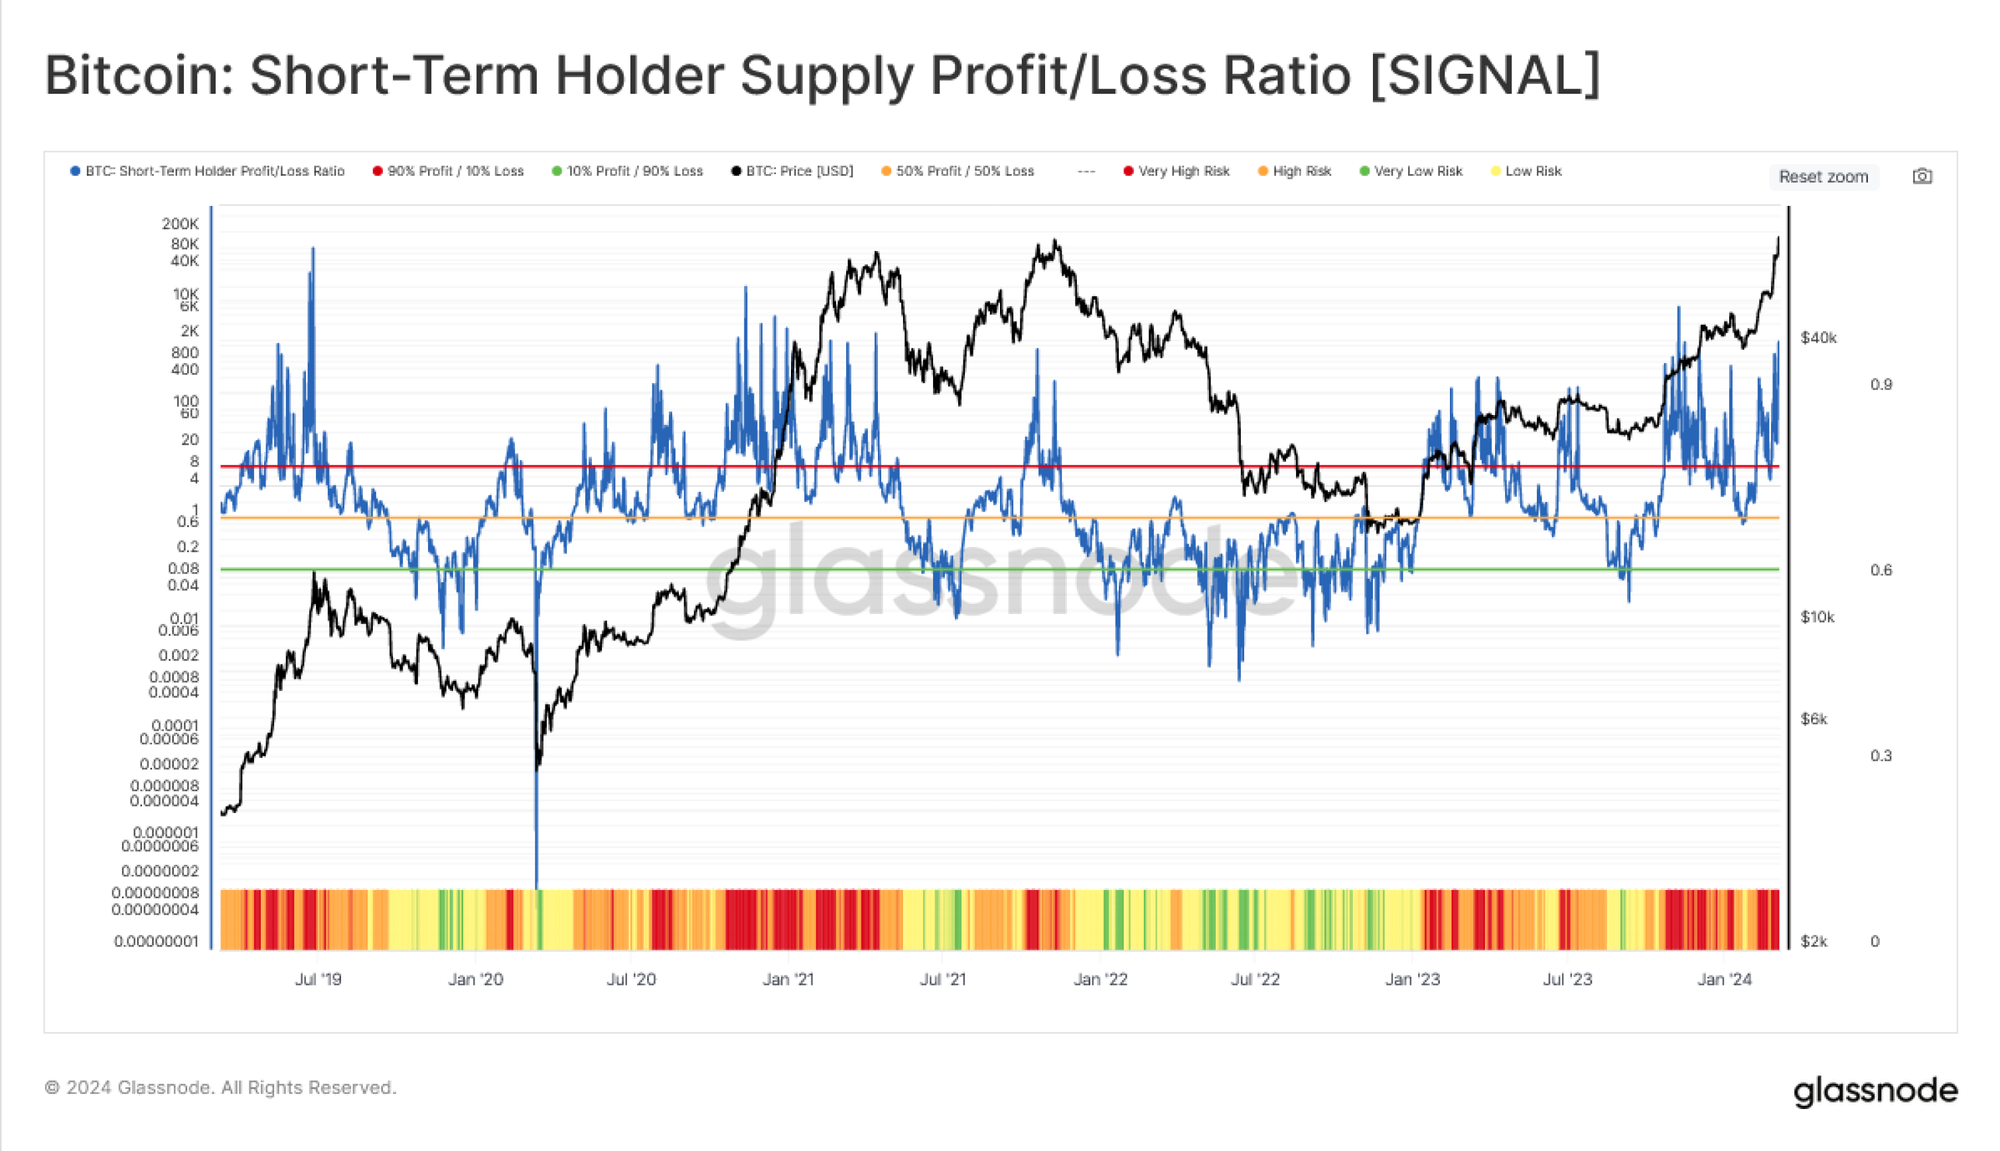
STH-SPLR above 9 signals more than 90% of new investors in profit, signalling a VERY HIGH-RISK state, from new investors’ perspective. The overheated values in this chart are usually associated with local top-heavy structures in the market.
Short-Term Holder Activity in Profit & Loss:

This indicator gauges the intensity of profit and loss realization from the new investors’ side. Currently, these players are locking profit at 2.8 STD, which puts the present state in a VERY HIGH RISK (> 2 STD). This means short-term holders are seizing the opportunity and cashing out at elevated rates.
Market Momentum Check-In
A comprehensive update on all the market momentum indicators can be found in the Tracking Market Momentum with On-Chain Data Dashboard in Glassnode Studio (available to Enterprise users). Here is the most recent update on a few selected metrics and indicators:
On-Chain Momentum Signal:

The composite momentum signal combines eight key indicators to gauge Bitcoin’s market momentum across the key on-chain activity areas described above (network activity, market profitability, spending behaviour, and wealth distribution). Currently, all eight conditions of the composite signal are met, signalling strong positive momentum in the Bitcoin market. This indicates a clear and comprehensive bullish sentiment across multiple analysis categories.
Metric Spotlight: SLRV Ribbons
SLRV Ribbons (Short-Term Long-Term Relative Value Ribbons) is a metric that compares the percentage of Bitcoin that was last moved within the last 24 hours with the percentage that was last moved between 6-12 months ago.
Interactive example of an SLRV Ribbons analysis
- Trend to Look For: A high SLRV Ratio indicates a surge in short-term transactional activity compared to long-term holding, often reflecting an influx of new money. A low ratio suggests reduced short-term activity and possibly a growing base of long-term holders.
- Historical Example: The positive crossovers between the 30- and the 150-day successfully marked major uptrends, both during bull markets (such as in 2017 and 2020) as well as in market recovery phases (in 2019 and, more recently, in 2023)
- Tools to Employ: Analyze the SLRV ribbons to observe the crossover points between short-term and long-term moves. Pay particular attention to negative crossovers as they may indicate significant shifts in market dynamics or wealth distribution.
Metric Variations: Consider combining the SLRV Ribbons or SLRV Ratio analysis with other indicators like market cap trends and volume analysis to get a more nuanced understanding of market movements.
Get Personalised Insights
We hope that Finance Bridge continues to provide valuable insights and helps you navigate the crypto landscape more effectively.
If you have an idea about how we could improve this newsletter to make it more practical for you, we invite you to engage with us. Do you have any questions about the content of this issue or any other queries? Would you like to connect directly with our team of analysts? Or are you interested in discovering how you can leverage Glassnode’s full potential?
Don’t hesitate to reach out. Your thoughts and insights will help us continue to improve the quality of our services and this newsletter, so we’re genuinely excited to hear from you. Schedule a call with a dedicated member of our Institutional sales team to begin the conversation.
Disclaimer: This report does not provide any investment advice. All data is provided for information and educational purposes only. No investment decision shall be based on the information provided here and you are solely responsible for your own investment decisions.

- SEO Powered Content & PR Distribution. Get Amplified Today.
- PlatoData.Network Vertical Generative Ai. Empower Yourself. Access Here.
- PlatoAiStream. Web3 Intelligence. Knowledge Amplified. Access Here.
- PlatoESG. Carbon, CleanTech, Energy, Environment, Solar, Waste Management. Access Here.
- PlatoHealth. Biotech and Clinical Trials Intelligence. Access Here.
- Source: https://insights.glassnode.com/finance-bridge-bitcoin-new-ath/

