SNEAK PEEK
- FIL price drops due to market trends and profit-taking.
- Bollinger bands indicate a bearish trend with potential sell opportunities.
- ROC suggests bearish momentum in the FIL market but a possible positive turnaround.
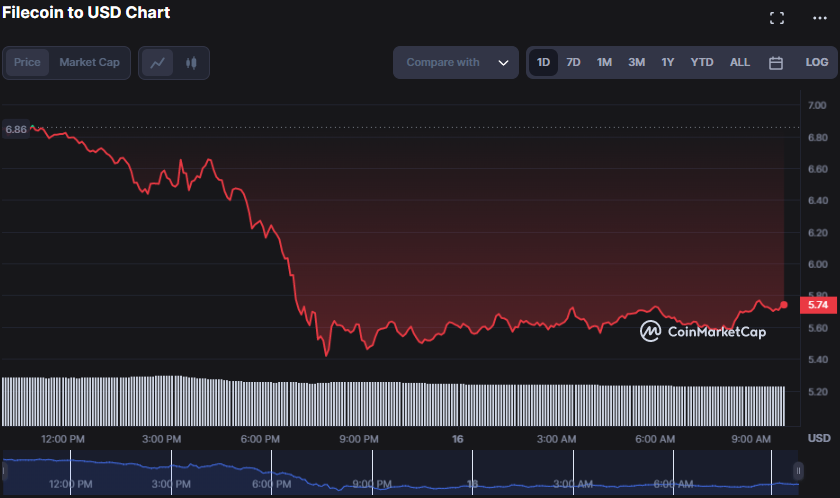
In the previous 24 hours, the Filecoin (FIL) market has dramatically declined, with values going from an intra-day high of $6.87 to a 24-hour low of $5.40. This price drop may be attributed to the cryptocurrency market’s general unfavorable trend and potential profit-taking by investors who purchased FIL at cheaper rates.
The bears were still in charge at press time, and FIL was trading at $5.74, a 16.27% rise.
During the recession, market capitalization and 24-hour trading volume fell by 15.88% and 18.22%, respectively, to $2,328,696,592 and $817,627,171. This drop shows traders’ loss of trust in the market during the economic crisis, which leads to less trading activity and a decline in the market’s total worth.
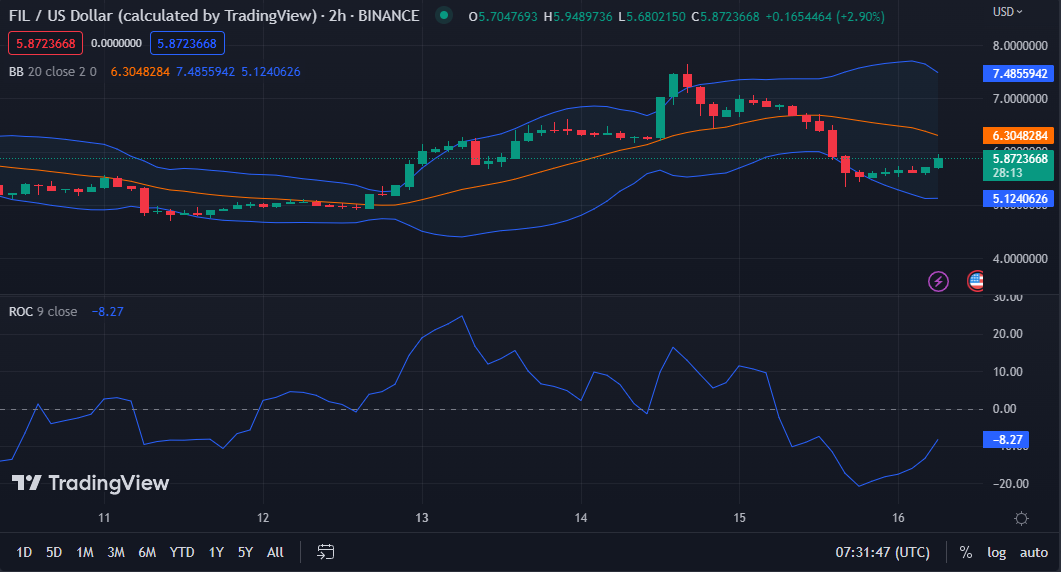
Bollinger bands moving southwards on the FIL price chart, with the upper band at 7.4648225 and the lower band at 5.1186936, indicate that the FIL price is currently in a bearish trend and that traders may have opportunities to sell at a higher price before the price drops further towards the lower band.
This concept is supported by the price action’s move towards the lower band, indicating that the bears’ control is expanding and that traders should use caution when contemplating purchases.
The Rate of Change (ROC) swings in the negative area with a value of -8.40, indicating the power of the bears in the FIL market. This movement in the negative region means market momentum is now bearish, and selling pressure is more significant than purchasing pressure, suggesting a likely downward trend soon.
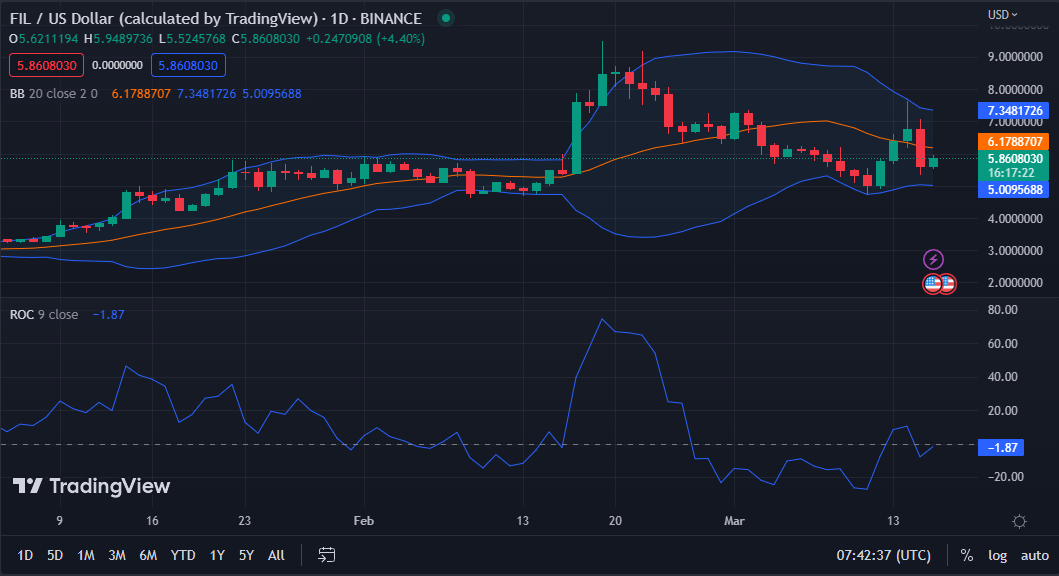
The upper Bollinger band on the 24-hour price chart contacts 7.348144, while the lower bar touches 5.0114042, indicating a linear Bollinger band movement. This movement suggests that, although the market is adverse in the short term, there is a possibility of a positive turnaround soon as the price approaches the lower band, signaling a potential buying opportunity for traders.
This action boosts traders’ confidence in the market and may attract additional buyers, thus pushing up prices and producing a positive trend.
Since the Rate of Change reads -1.84 and heads north toward the “0” line, the short-term bearishness may be ending, signaling a likely move toward a more positive feeling in the near future.
This expectation of a bullish rebound stems from the fact that when the ROC swings into the positive area, it indicates that momentum is developing. Filecoin may see an upward price movement, providing a buying opportunity for traders eager to join the market.
Filecoin’s bearish trend offers opportunities for cautious selling, but signs of a potential bullish rebound suggest a buying opportunity for traders.
Disclaimer:Cryptocurrency price analysis is highly speculative and volatile and should not be considered financial advice. Past and current performance is not indicative of future results. Always do your own research and consult with a financial advisor before making investment decisions.
- SEO Powered Content & PR Distribution. Get Amplified Today.
- Platoblockchain. Web3 Metaverse Intelligence. Knowledge Amplified. Access Here.
- Source: https://investorbites.com/filecoin-fil-price-analysis-16-3/

