Executive Summary
- The digital asset market continues trading within a historically low volatility regime, with several metrics indicating extreme apathy and exhaustion has been reached in the $29k to $30k range.
- There are some indicators that the market is slightly ‘top-heavy’ as indicated by the concentration of Short-Term Holder supply and cost basis around the current spot price.
- We explore several new iterations of SOPR by age band as a tool to monitor profit taking behavior by various cross sections of the market.
Modest Capital Inflows
The Realized Cap is one of the most important metrics in the on-chain analysis toolbox, representing the cumulative capital inflow since inception. Both the magnitude and gradient of the Realized Cap are informative, suggesting over $16B in value (+4.1%) has flowed into Bitcoin YTD.
However, we can also see the climb is quite shallow, a far cry from the steep rise seen during the 2021-22 uptrend. This indicates that whilst capital is flowing in, it is doing so at a very modest pace.

We can decompose the Realized Cap into the Long-Term and Short-Term Holder components. The wealth held by the STH cohort has experienced an increase of +$22B this year, whilst the LTH cohort has seen an approximately equal reduction of -$21B.
This reflects two mechanics:
- Short-Term Holders chasing the market higher, creating an elevated average cost basis.
- Supply acquired at prices below $24k in Q1 maturing into LTH status, resulting in a declining average cost basis.
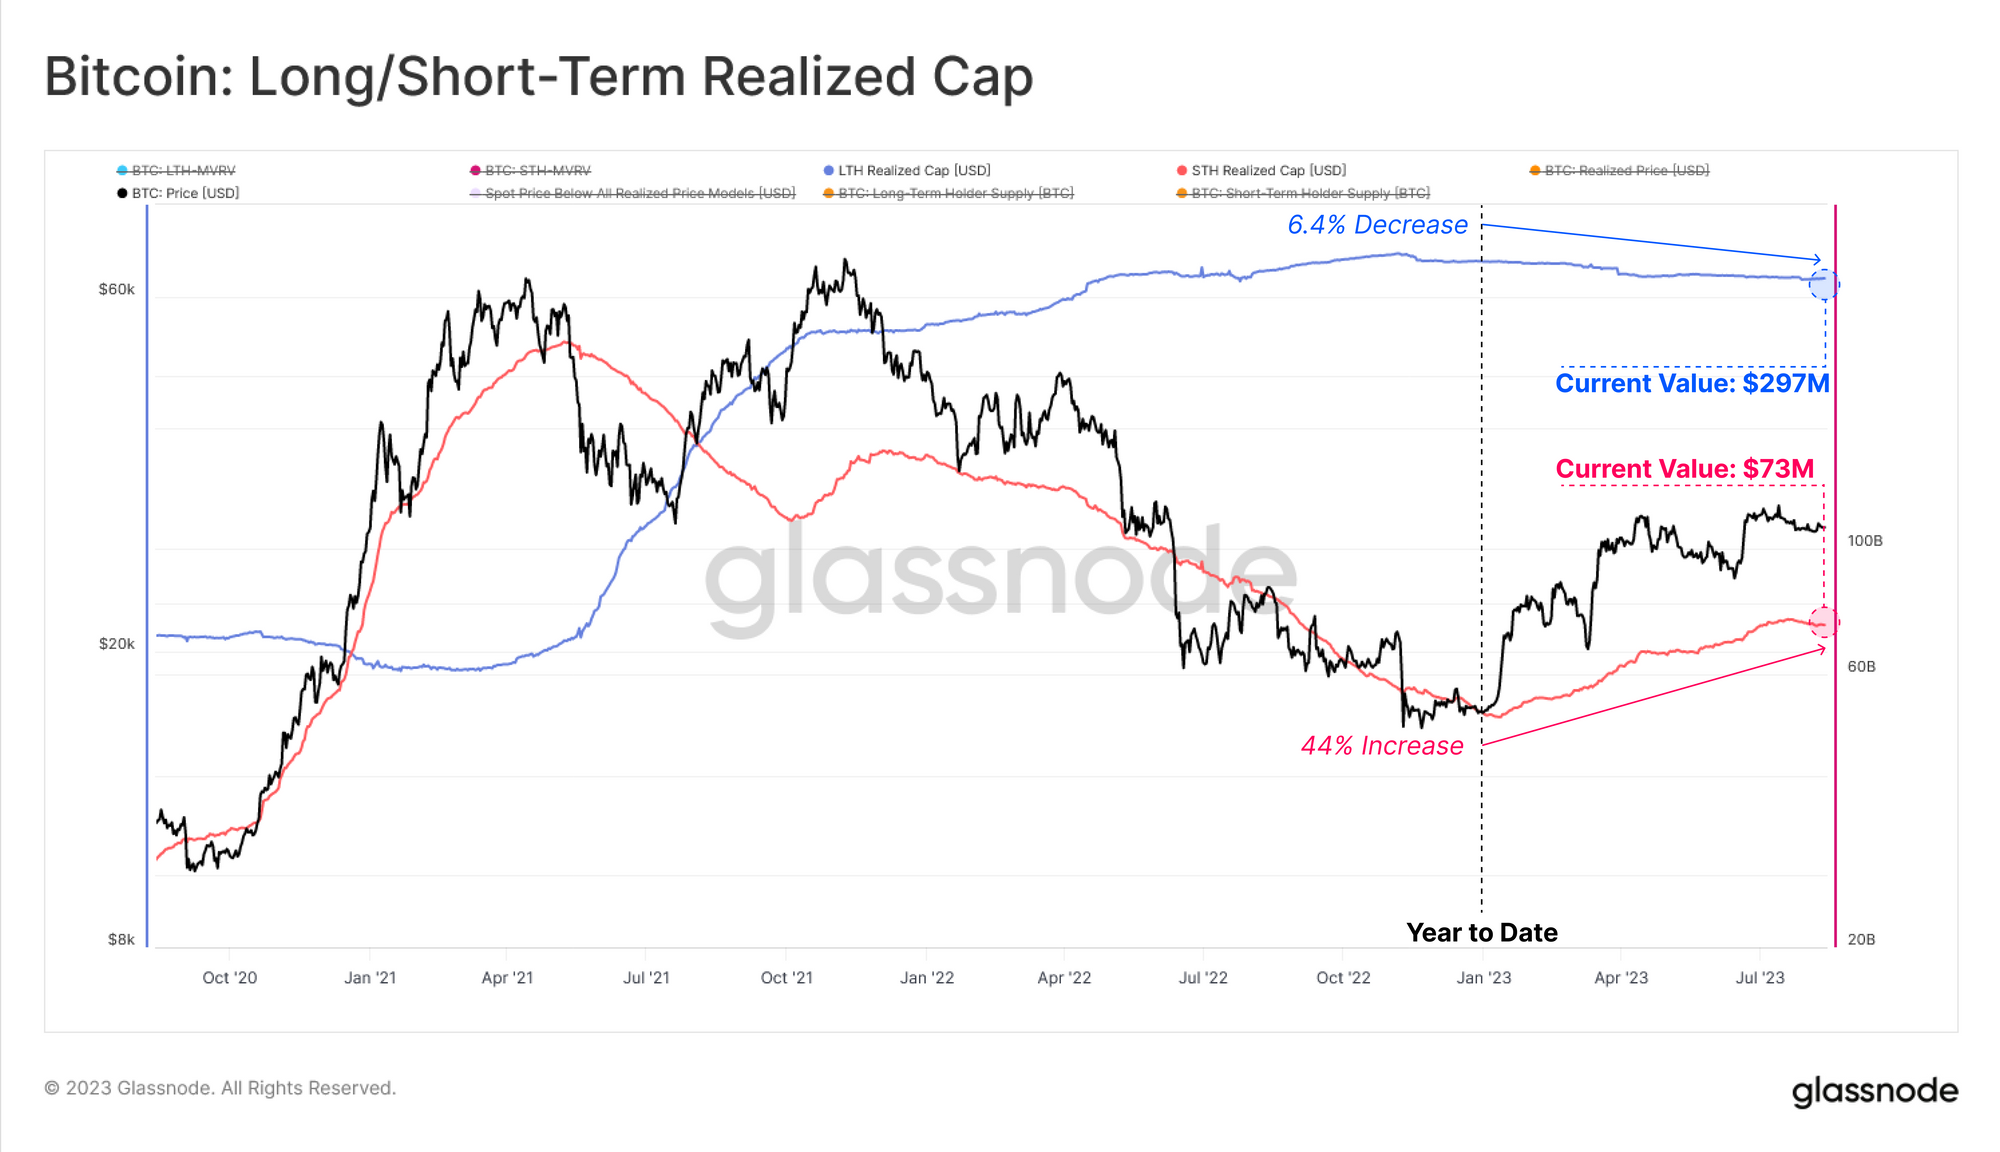
We can see this within the cost basis estimates for each cohort. The STH cost basis is up +59% YTD, currently trading at $28.6k. The LTH cost basis is trading much lower at around $20.3k.
The separation between these two cost basis is an indicator that many recent buyers have a relatively elevated acquisition price.

We can confirm this using the URPD distribution split into these two cohorts. Note how a large cluster of STH coins 🔴 are located between $25k and $31k. On a macro scale, this supply distribution does resembles similar periods during bear market recoveries in the past. However, on a shorter timeframe, it could be argued to be a slightly top heavy market, with many price sensitive investors at risk of falling into an unrealized loss.
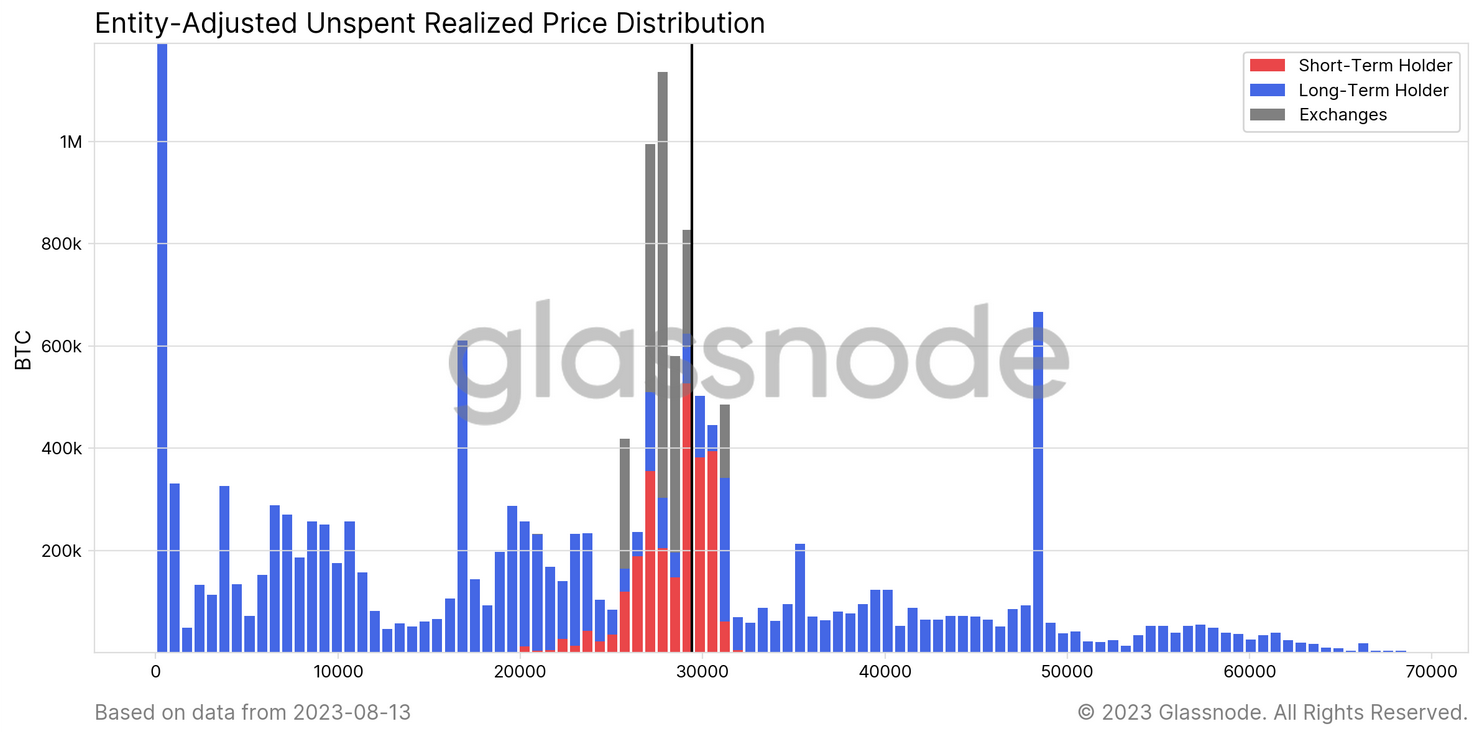
We note that the the supply held by Long-Term Holders continues to increase, hitting an ATH of 14.6M BTC. In direct contrast, Short-Term Holder supply has declined to multi-year low of 2.56M BTC.
Overall, this suggests that conviction of Bitcoin investors does remain impressively high, and very few are willing to liquidate their holdings.

Apathy, Exhaustion and a Lack of Volatility
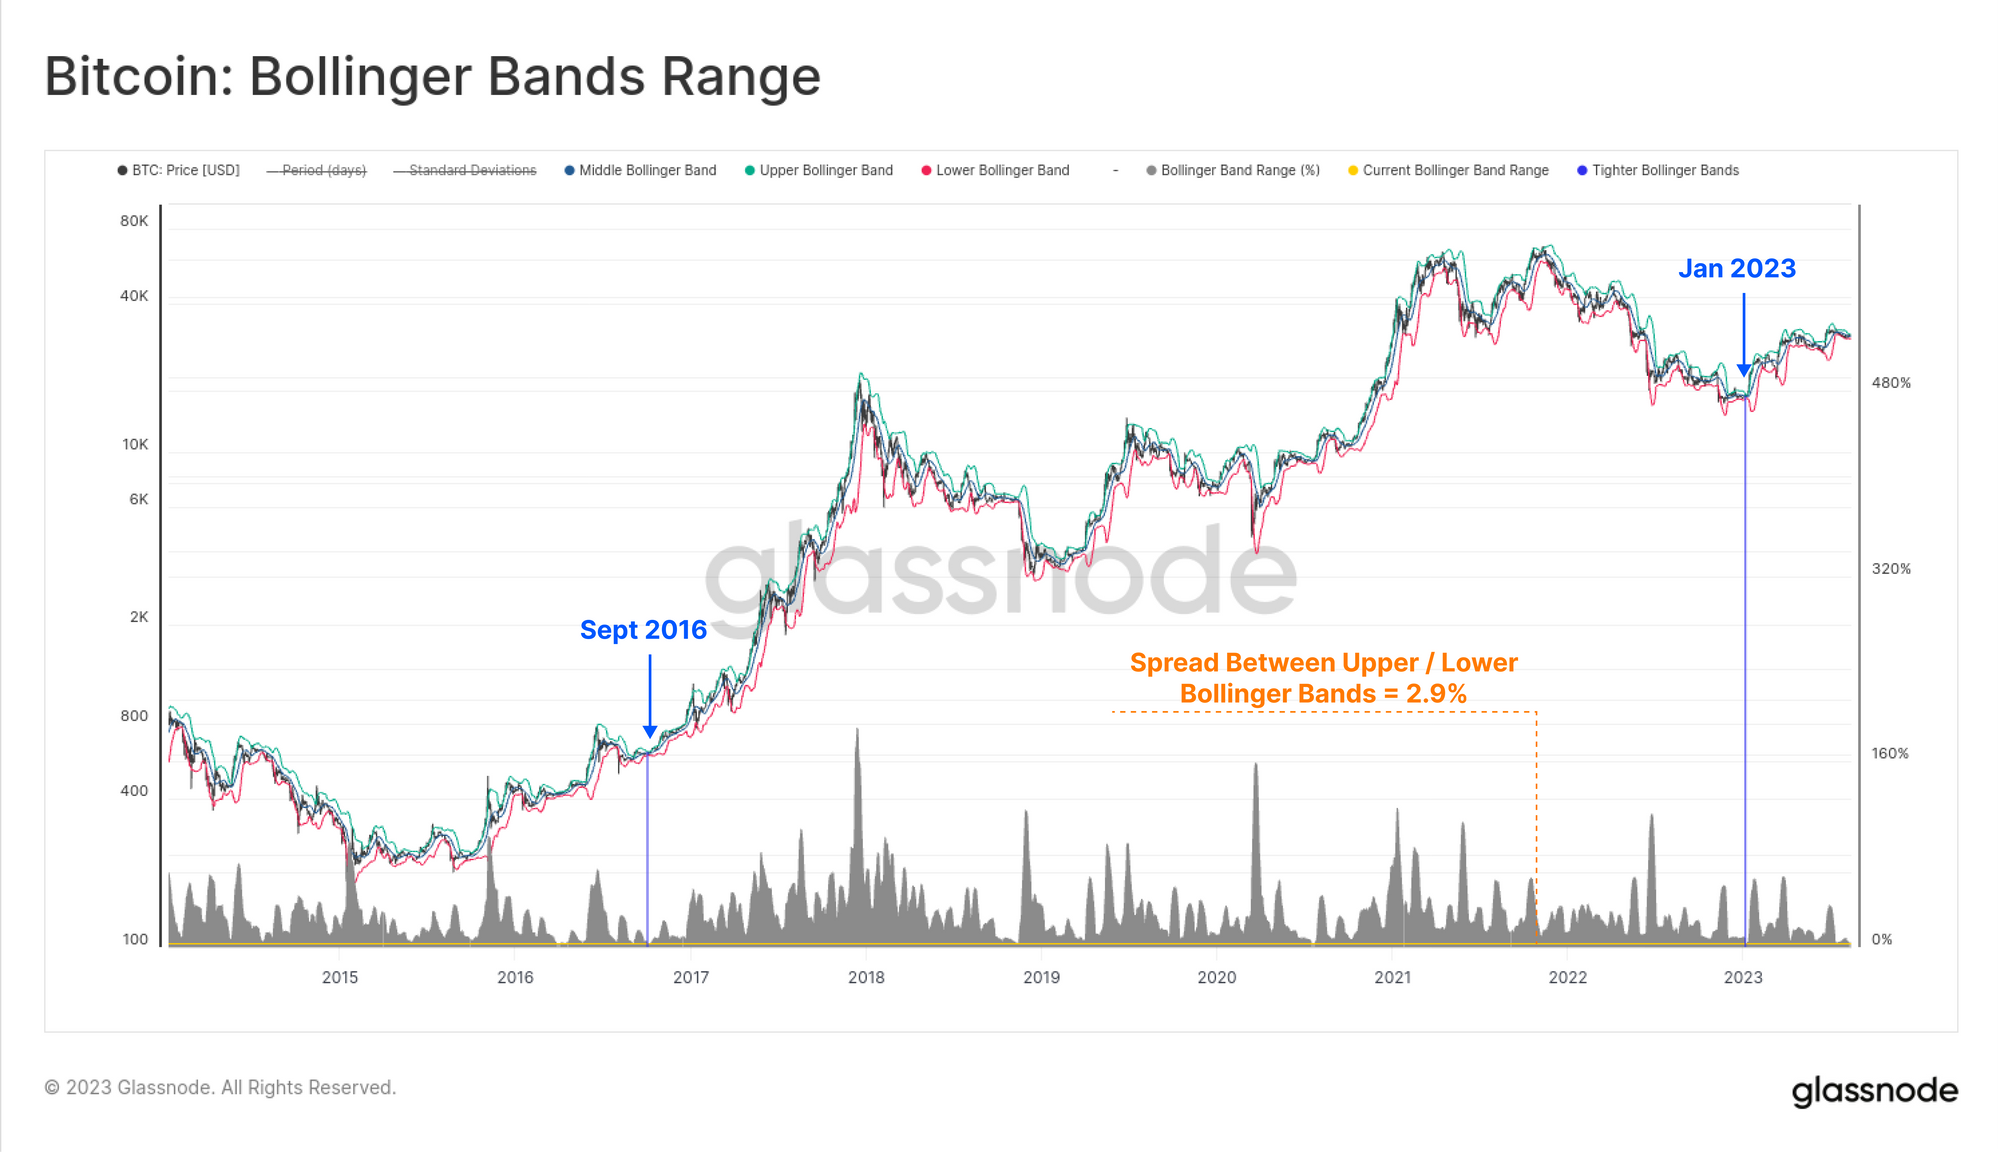
As we covered in last weeks edition (WoC 32), price volatility for BTC has collapsed to historical lows. The upper and lower Bollinger Bands are currently separated by just 2.9%, with a tighter spread only seen on two occassions in history:
- Sept 2016 – Price was $604 and was early in the 2016-17 run-up.
- Jan 2023 – Price was $16.8k and traded within a $52 range to start the year (WoC 2).
Another lens to observe this volatility compression (investor exhaustion) is via the spending behavior of investors. Here we use Realized Value as a measure under the following framework:
- High volatility motivates investors to spend coins that were acquired at a cost basis much higher (in loss) or lower (in profit) than the spot exchange rate.
- Low volatility (and investor exhaustion) results in most coins moved on-chain having a cost basis very close to the spot rate (and thus realized very small profit/loss).
An ideal tool to monitor this is the Sell-Side Risk Ratio, which compares the absolute value of realized profit loss (the change in asset valuation) to the realized cap (asset valuation). For STHs, we can see this metric is effectively at all-time lows, with fewer than 27 trading days (0.57%) recording a lower value.
This indicates that all investors who sought to take profit or loss at this price range have now done so, and the market must make a move to motivate new spending (i.e. an indicator for impending volatility).

The Short-Term Holder Profit / Loss ratio shows that profit taking remains dominant for this cohort, however it has cooled off back towards neutral in recent weeks. If sufficient new demand flows in, this ratio should remain above 1. However if losses start to accellerate (P/L Ratio falls below 1), it may indicate that stress within the ‘top heavy market’ is starting to play out.
📊

If we turn to the LTH cohort, we can also see they’re also within a profit driven regime, having only just recovered from the severe losses throughout the 2022 bear market. The LTH Profit/Loss Ratio remains small in magnitude, and a far cry from prior bull market conditions.
Only 472 / 4963 (9.5%) of all profitable trading days have recorded a lower value, highlighting the infancy of this uptrend.

The Long-Term Sell-Side Risk Ratio is also pushing towards all-time-lows, with only 44 trading days (1.1%) recording a lower value. Overall, this suggests that volatility and price expansion (in either direction) is likely required to break this spell of investor apathy and exhaustion.
📊

The Temperature of Supply
Analysis of the Bitcoin supply and demand balance often utilises the dimension of ‘investor holding time’, accounting for the time since a coin last moved on-chain. Often we can relate these age bands to investor conviction as is the case with the Long/Short-Term heuristic at 155-days (research here).
We can also consider the supply under a slightly different framework to identify market shifts:
- 🔴 Hot Supply (< 1w) is the most active and liquid portion which has transacted within the last 7-days.
- 🟠 Warm Supply (1w-6m) comprises the less active component of Short-Term Holder supply, right through to the start of the Long-Term Holder cohort.
- 🔵 Single-Cycle Long-Term Holders (6m-3y) being the supply which transacted within the last three years, and is therefore reasonably likely to respond to macro market trends (see our report detailing this cohort here).
Hot Supply (< 1-week)
Starting with the most active and liquid of coins, we can see that Hot Supply currently accounts for just 2.8% of all invested value held in BTC. This is in line with the extremely ‘illiquid’ hangover periods seen after all late stage bear markets. It describes a market where only the HODLer cohort remain, and trade volumes tend to be extremely low.

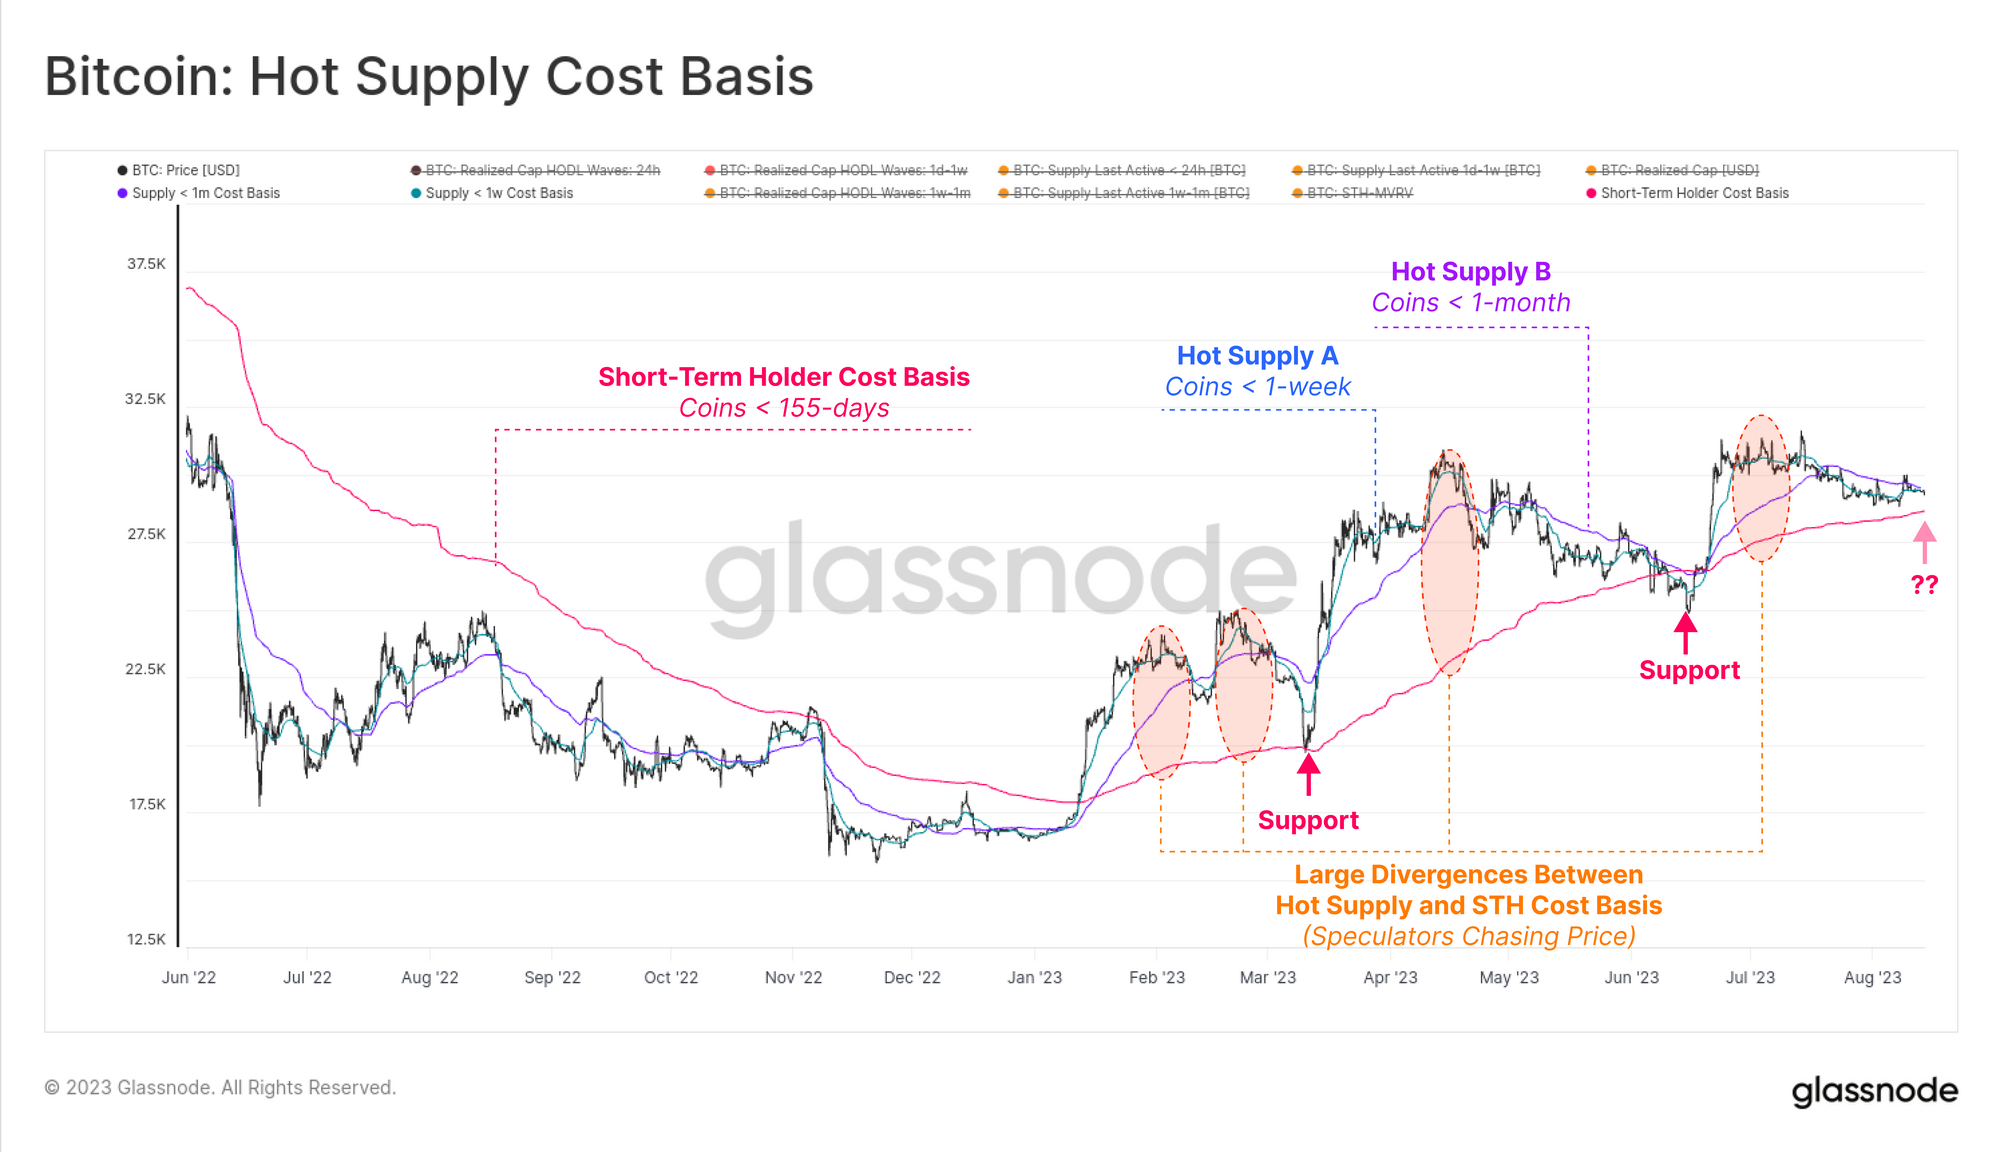
We recently rolled out Workbench support for the Realized Cap HODL Waves (and similar multi-line style charts). We can use this tool to calculate the cost basis for hot supply and compare it to that of the parent Short-Term Holder cohort. From this we can identify two interesting pieces of market structure:
- The STH cost basis tends to provide support in uptrends as investors acquire near their break-even point during corrections.
- Large deviations between the Hot Supply cost basis and the STH cost basis often align with local market peaks.
This latter point is a result of speculators chasing the price into local peaks, driving up the Hot Supply cost basis, but increasing the volume of supply at risk of a drawdown. This can create a near-term pause in the rally until sufficient demand returns during the correction.
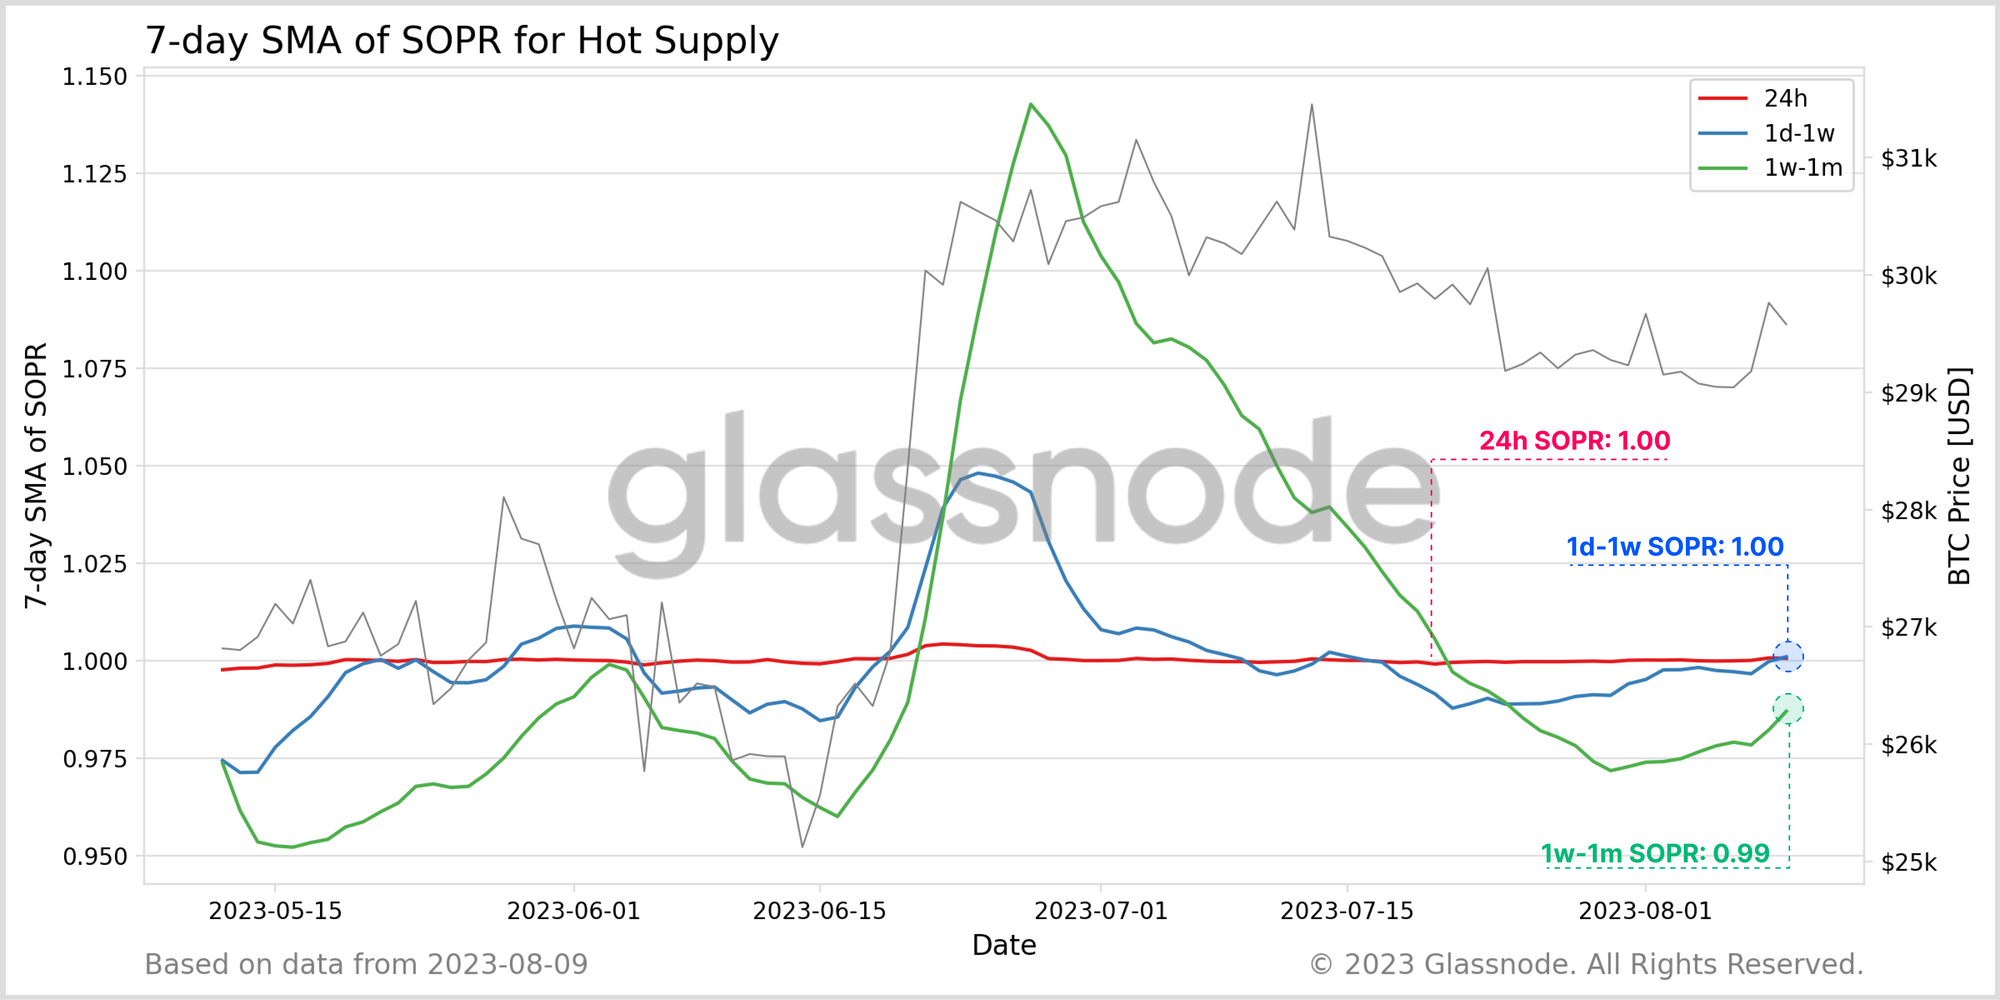
If we look to the SOPR family for Hot Supply, we can see this playing out in their profit taking behavior:
- 🔴 < 24h coins tend to be spent close to their break-even price.
- 🔵 1d-1w coins take profits (SOPR > 1) during rallies and local market highs.
- 🟢 1w-1m coins see a similar profitable peak, although at a larger amplitude due to the longer holding time (and thus larger price delta since acquisition).
This early work on SOPR variants by age bands provides an interesting insight into the supply and demand structure playing out day-to-day.
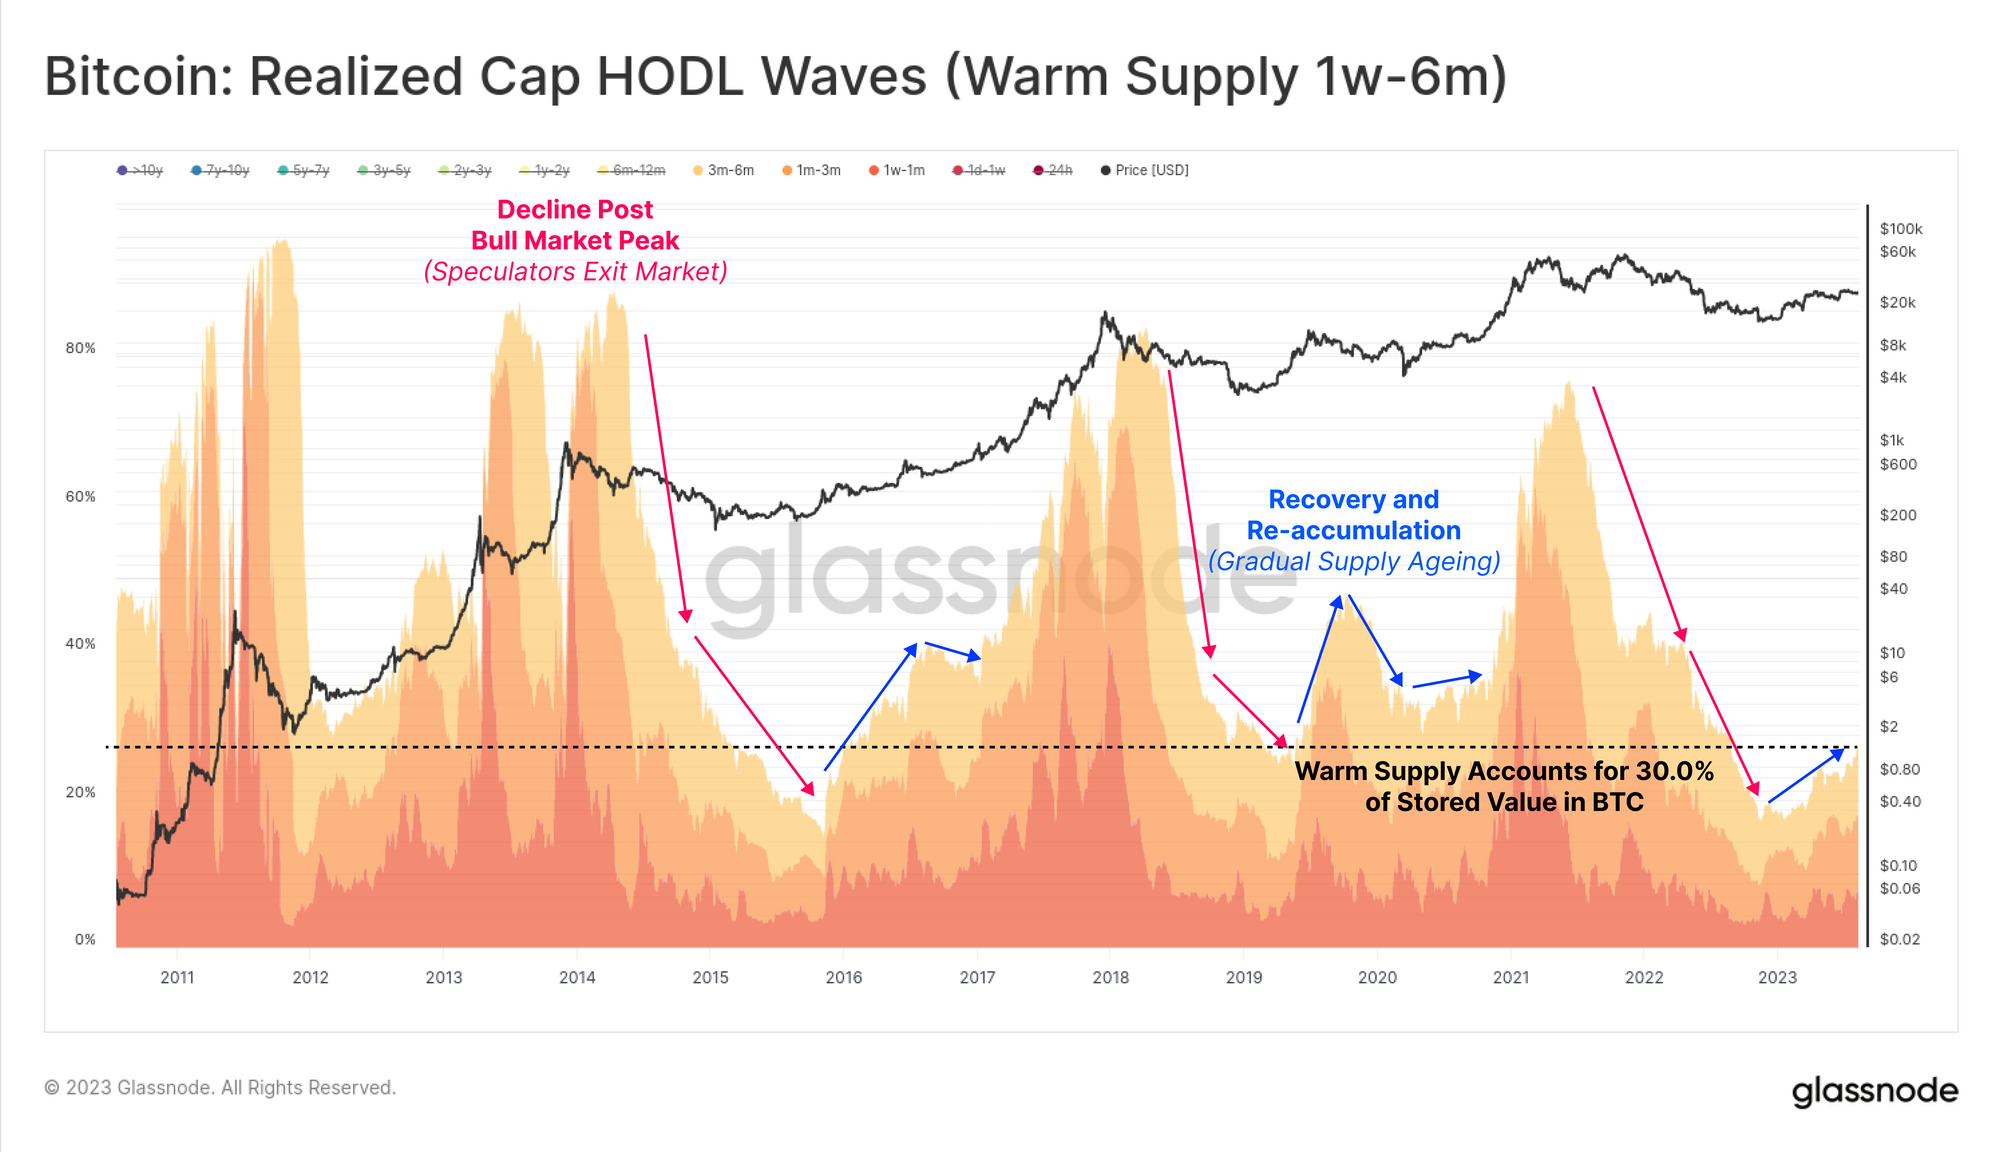
Warm Supply
Moving onto the Warm Supply group (1w-6m), we can see a slight uptick YTD, accounting for around 30% of the wealth stored in Bitcoin.
Whilst this value is meaningful in magnitude, it is extremely low in a comparitive context. By proxy, the extremely small proportion of wealth held within both Hot and Warm supply indicates that the most significant holdings are within the more mature Long-Term Holder supply.
Given Warm Supply accounts for the majority of the age range (and coin volume) within the Short-Term Holder cohort, the average cost basis is very similar to STHs. If we look at it through the lens of the Warm Supply MVRV ratio, we can see it is approaching a retest of its break-even level at $27.6K.
This further supports the Sell-side Risk Ratio observations from the prior section, where volatility is likely brewing.

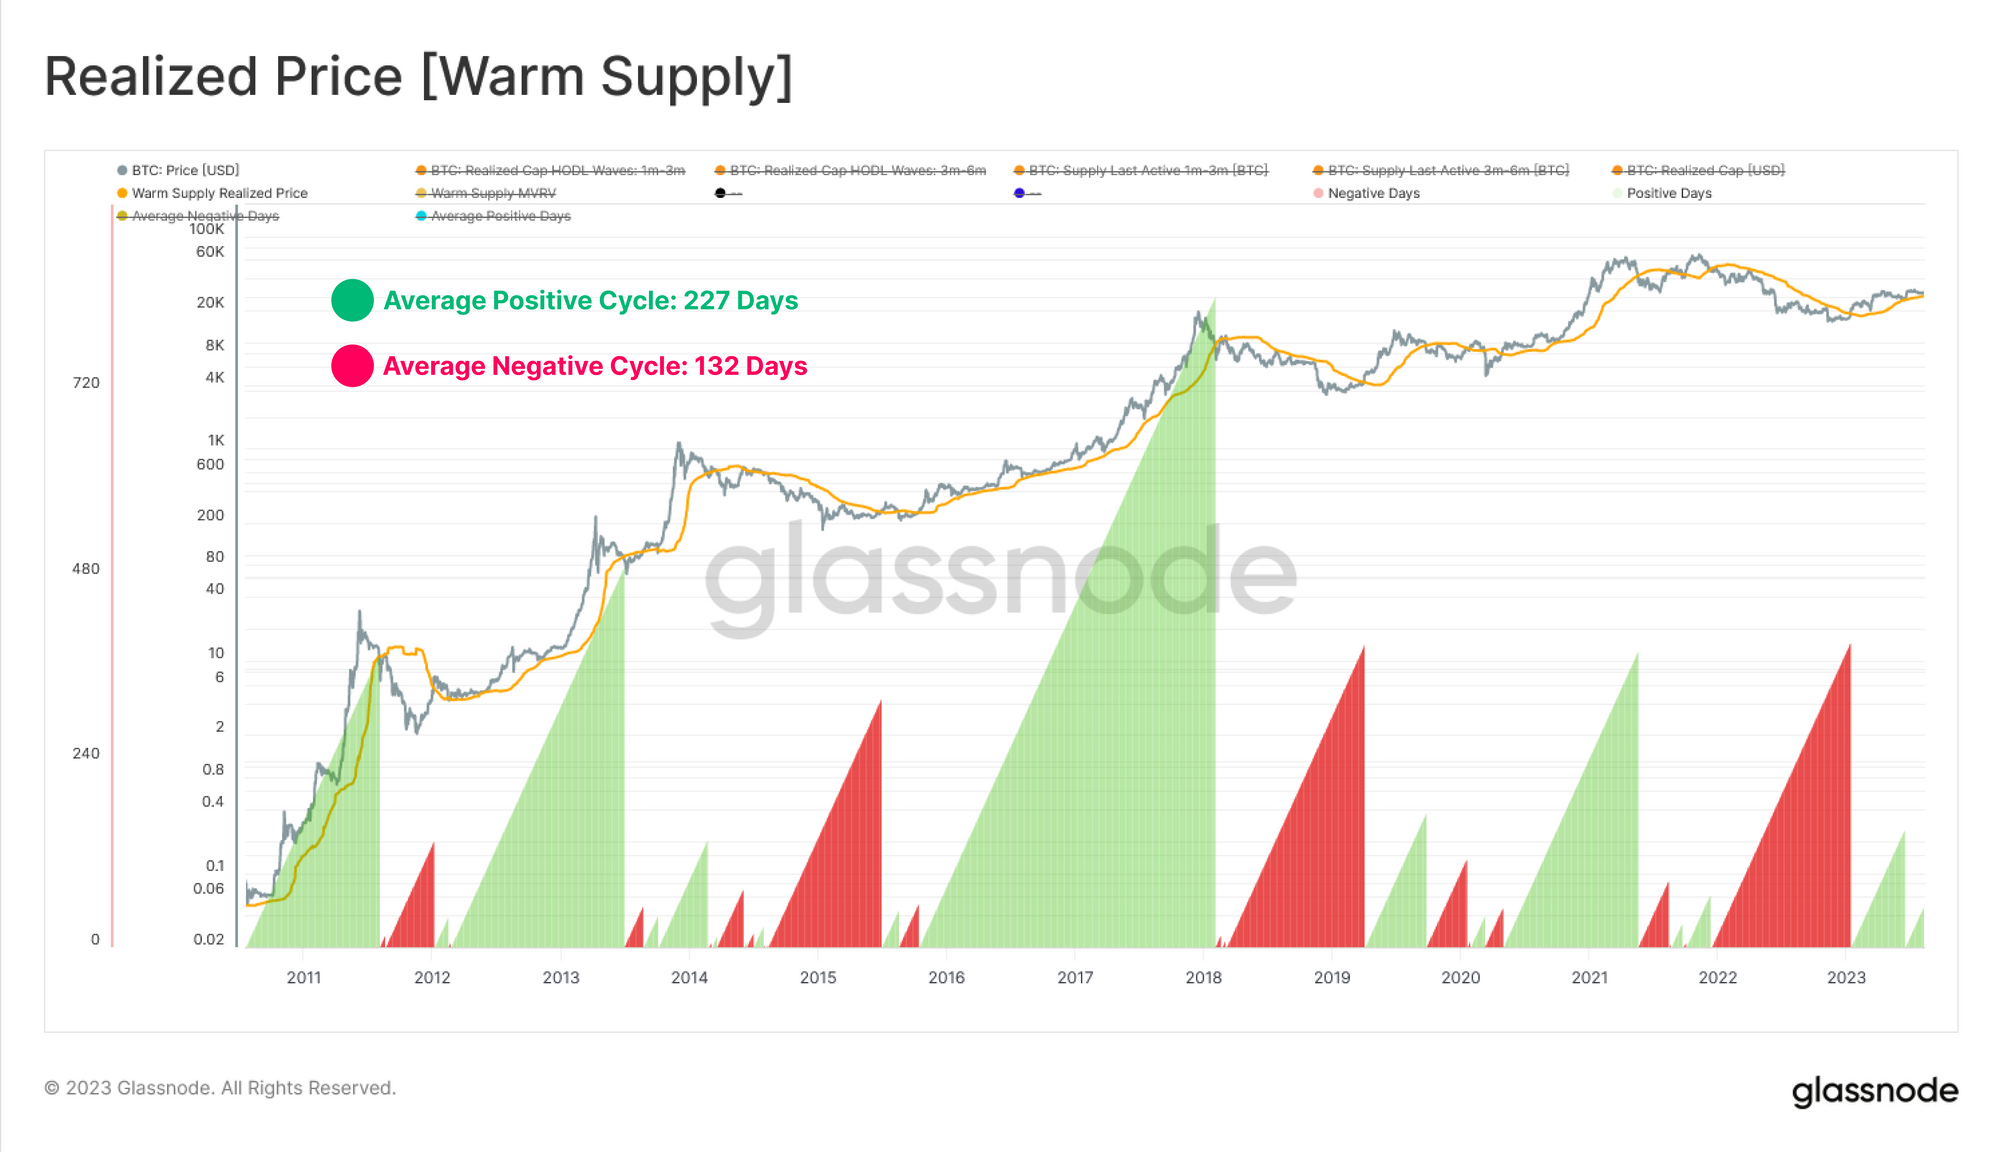
Extended breaks above, or below the Warm Supply cost basis have historically aligned with a macro shift in the market trend, with the average uptrend lasting 227 days, and an average downtrend lasting 132 days.
The 2023 rally has now traded above this model for 212-days so far, hovering slightly above it today.
The 2023 market strength was successfully capitalized upon, with profit taking visible across all SOPR constituents within the Warm Supply cohort. The average spent coin is locking in between 4% and 9% profit over the last few months.

Single Cycle Long-Term Holders
The final cohort are the Single Cycle Long-Term Holders. This cohort covers investors that weathered the full spectrum of excitement, chaos, and volatility of the 2020-23 cycle.
HODLing remains the preferred market dynamic for this group, accounting for over 63% of the invested capital. This has reached similar heights as past transitional phases between late stage bear markets, and new macro uptrends.

The cost basis of these single cycle holders is currently at $33.8k, suggesting that this group is still holding an average unrealized loss of -13.3%. This compares to the average LTH with a cost basis of $20.4k and an unrealized profit of +43.6%.
Since the classic LTH cohort includes long-dormant, lost, and deep HODLed supply, much of which carries tremendous unrealized profit, it is likely that it underestimates the true acquisition price of the average high conviction investor. As such, it suggests that much of the Bitcoin market still remains underwater on their holdings, and that the damage of the 2022 bear market still plays a meaningful role in guiding investor decisions.

Finally, we see a very interesting divergence between SOPR variants within this cohort:
- 🟡 6m-12m SOPR describes investors acquiring coins between Aug 2022 (post LUNA and 3AC collapsing) and Feb of 2023. This group is currently locking in an average profit of +27% (cycle low buyers).
- 🟤 1-2y SOPR describes investors from Aug 2021 to Aug 2022, whom are still locking in losses over -21% on average (largely cycle top buyers).
- 🟣 2y-3y SOPR is oscillating around break-even, and captures investors from Aug 2020 to Aug 2021 with prices ranging from $10k through to $64k (the bull market buyers).
This demonstrates that a great majority of LTHs are actually transacting at a loss, and only those from the 6m-1y age group are in a meaningful degree of profit.

Volatility in the digital asset space remains historically low, with investors reaching an all-time-low in willingness to spend coins on-chain. The conditions of the Bitcoin market continue to resemble the bear market hangover seen in prior cycles, with an outsized wealth held by long-term high conviction holders.
However, with this low volatility comes apathy and exhaustion, which often entails a relatively weak influx of demand. The Realized Cap is climbing, but only very slightly, suggesting a very boring, choppy, sideways market may remain on the road ahead. This is likely compounded by the fact a large majority of the Bitcoin market is still underwater on their holdings, and likely to create resistance throughout the recovery.
Disclaimer: This report does not provide any investment advice. All data is provided for information and educational purposes only. No investment decision shall be based on the information provided here and you are solely responsible for your own investment decisions.

- SEO Powered Content & PR Distribution. Get Amplified Today.
- PlatoData.Network Vertical Generative Ai. Empower Yourself. Access Here.
- PlatoAiStream. Web3 Intelligence. Knowledge Amplified. Access Here.
- PlatoESG. Automotive / EVs, Carbon, CleanTech, Energy, Environment, Solar, Waste Management. Access Here.
- PlatoHealth. Biotech and Clinical Trials Intelligence. Access Here.
- ChartPrime. Elevate your Trading Game with ChartPrime. Access Here.
- BlockOffsets. Modernizing Environmental Offset Ownership. Access Here.
- Source: https://insights.glassnode.com/the-week-onchain-week-33-2023/

